Glass & substrate science
Float Glass Tin Side and Air Side: How Much Difference for Chrome Coating

The face of float glass that contacted the tin bath carries a tin diffusion layer a few micrometres deep. This article estimates the tin concentration profile with a diffusion model, explains how to identify the tin side with a 254 nm UV lamp, compares which differences in haze on heating, adhesion and durability are reliable and which must be tested in-house, and gives coating-side selection and marking practice.
Float glass is formed on a bath of molten tin: the lower face contacts the tin, the upper face faces a protective atmosphere. At forming temperature tin diffuses into the lower face, so the “tin side” and the “air side” differ in composition. The eye can barely tell them apart, yet cleaning, bake-out and film adhesion before chrome patterning may still differ. This article first estimates how deep the tin goes, then how to recognise the tin side, and finally which differences are well established and which must be measured yourself.
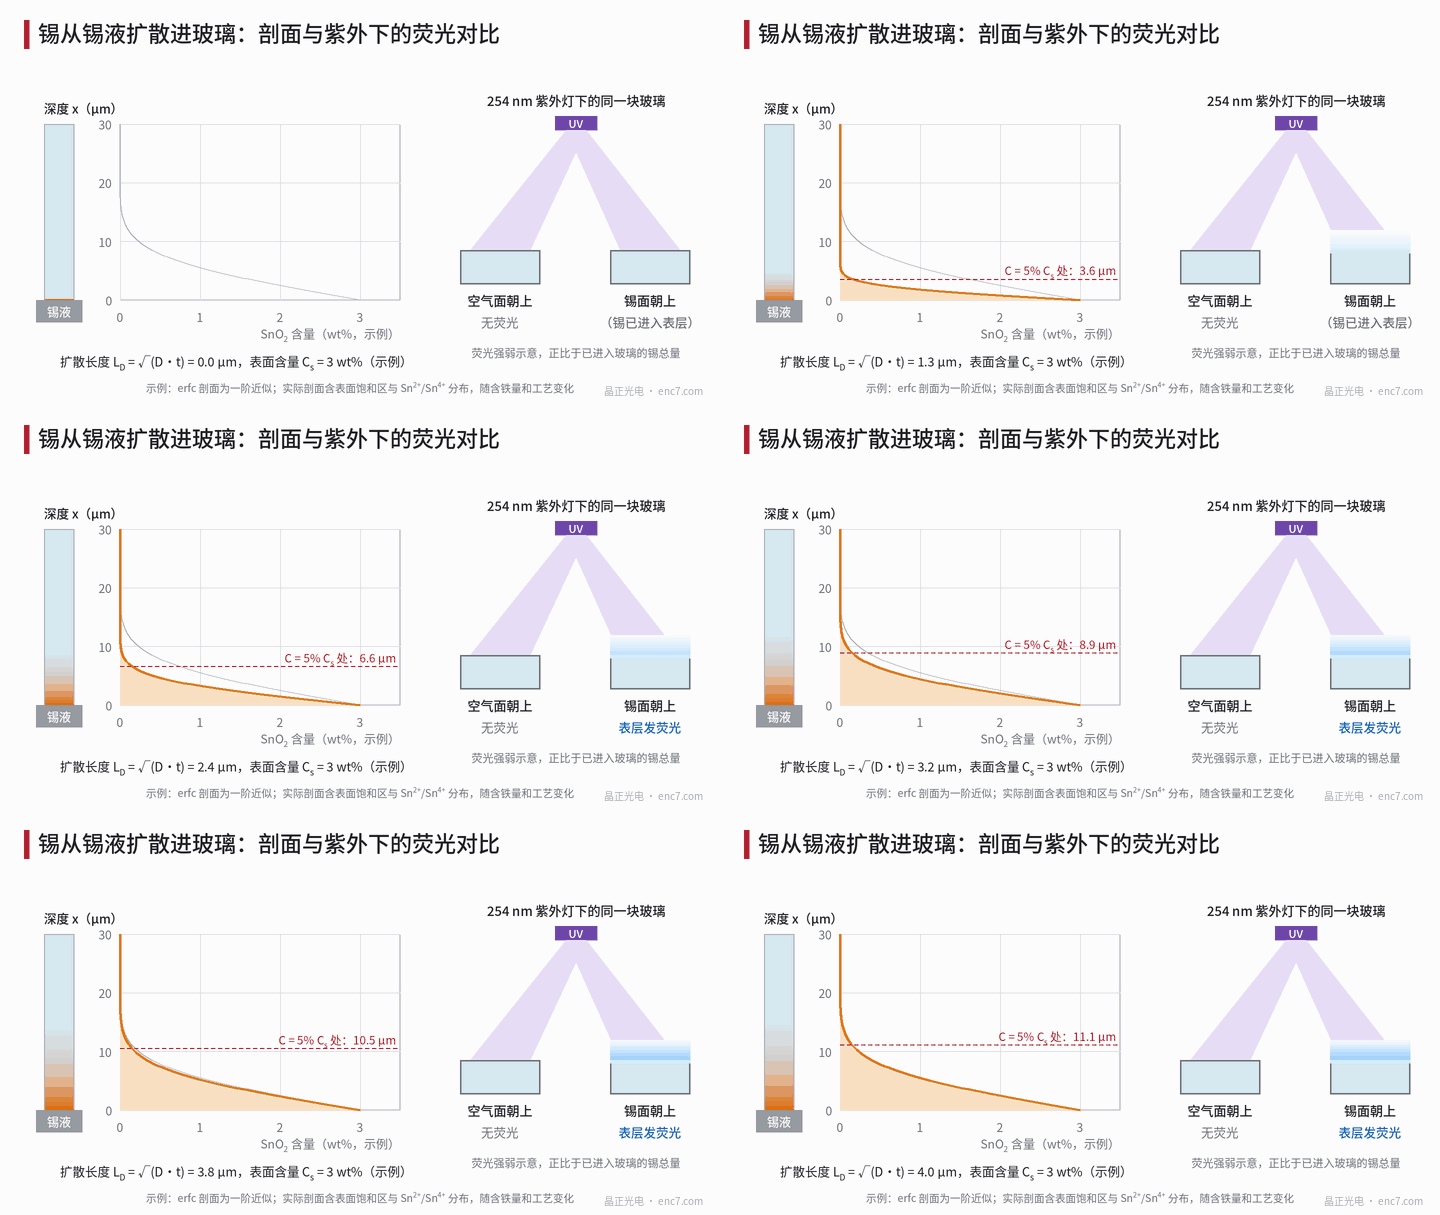
Tin diffusion profile: a few to more than ten micrometres
Tin enters the glass mainly as Sn²⁺ and falls off inward. The simplest first-order model is Fick’s second law with constant surface concentration:
C(x, t) = C_s · erfc( x / (2 L_D) ), L_D = √(D·t)
where x is depth from the tin-side surface, C_s the surface concentration, D the diffusion coefficient, t the contact time, and L_D the diffusion length. Reported surface contents are of the order of a few wt% SnO₂ and depths from a few to more than ten micrometres, varying strongly with iron content, bath temperature and dwell time. Taking the example parameters C_s = 3 wt%, L_D = 4 μm (assumed values, not tied to a product):
| Depth x (μm) | 0 | 2 | 4 | 8 | 12 | 16 |
|---|---|---|---|---|---|---|
| SnO₂ (wt%) | 3.0 | 2.17 | 1.44 | 0.47 | 0.10 | 0.014 |
The depths at which the concentration falls to 1, 0.1 and 0.01 wt% are 5.5, 12.0 and 16.6 μm, scaling with L_D: for L_D = 2 μm they are 2.7, 6.0 and 8.3 μm; for L_D = 6 μm they are 8.2, 18.1 and 24.9 μm (Figure 2). The example tin inventory converts to about 0.34 g/m² SnO₂ – a small amount, but all concentrated in the outermost few micrometres. Real profiles have a near-surface saturation zone and an Sn²⁺/Sn⁴⁺ distribution; erfc is only a first-order approximation and the numbers are for order of magnitude only.
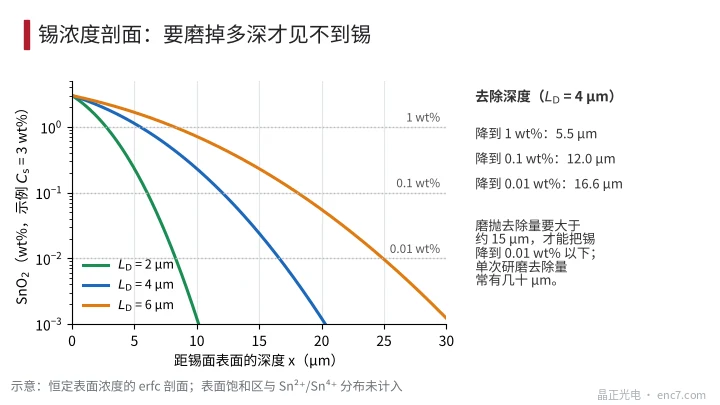
A direct corollary follows: a light polish of a few micrometres does not remove the tin. On the example profile, after grinding off 5 μm the surface still holds about 1.1 wt% and retains about 26% of the tin inventory; after 10 μm it falls to about 0.23 wt% and about 4%; only after 15 μm does it fall to about 0.02 wt%. A single grinding pass often removes tens of μm, so a ground-and-polished substrate has already lost its tin side, whereas as-received sheet that was only cleaned or “fire-polished” has not.
How to recognise the tin side
254 nm UV lamp. In a dark room, illuminate the glass obliquely with a short-wave UV lamp (wavelength about 254 nm): the tin-side surface emits a weak bluish-white fluorescence, while the air side barely glows – the usual shop-floor identification method. Points to watch: only short-wave UV works; long-wave UV lamps usually do not; glass itself absorbs strongly at 254 nm, so the lamp must illuminate from the tin-side face – with the tin side down the UV cannot enter and the sheet looks “non-fluorescent”, inviting a false call; the glow is weak, so observe in a dark room at an oblique angle and compare with a known tin-side sample. UV lamps can injure eyes and skin: wear UV-protective goggles and do not look into the tube.
Other corroboration. On heating in air the tin side may haze (see next section); the refractive-index difference between the two faces is too small to use for identification; on ground-and-polished substrates the tin is already gone and fluorescence no longer applies.
Which differences are reliable, which must be tested
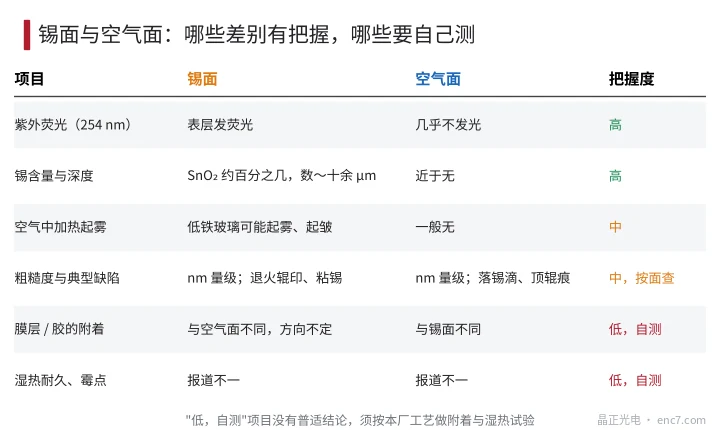
Figure 3 sorts the differences into three bands.
Higher confidence: tin content and fluorescence – the orders of magnitude above can be used with confidence.
Medium confidence: when low-iron glass is heated in an oxidising atmosphere, Sn²⁺ oxidises to Sn⁴⁺ with a volume change that can produce haze or wrinkling, often called “tin bloom” or “tin haze”; severity varies with iron content and atmosphere, and reports of the mechanism and temperature window differ. Surface defects also differ by face: the tin side may show lehr-roll marks and tin stickers, the air side tin drip-down from above and top-roll marks; incoming material should be inspected face by face.
No universal conclusion: adhesion of chrome films and adhesives, and damp-heat durability or mould spots – some reports favour the tin side, others the opposite, with no fixed direction. Likely causes are differences in near-surface chemistry, residual impurities and cleaning effectiveness between plants; other people’s conclusions cannot be transferred to your process. Run adhesion tests (cross-hatch, tape) and damp-heat tests with your own cleaning and coating process.
Coating-side selection guidance
- Consistency first: within one encoder-disc batch always use the same face, do not mix, and write the “coating face” into the process card.
- Without process evidence, default to the air side: no tin, no tin haze, and no tin fluorescence background, which may be cleaner for deep-UV exposure or inspection below 300 nm (needs measurement). This is a conservative default, not a proven advantage.
- Mark the tin side at incoming inspection with a UV lamp, or cut a fixed corner notch at cutting so the face remains identifiable.
- If the tin side must be used (e.g. to preserve the surface quality of the other face), first run adhesion and damp-heat comparison tests, then decide.
- For discs coated on both faces the difference can be ignored, but the orientation of each face should still be recorded.
- After grinding and polishing, judge by stock removal: less than about 10 μm of removal may still leave tin.
Engineering notes
- Tin side and air side can be identified with a 254 nm UV lamp; illuminate only from the tin-side face and always wear goggles.
- Tin concentration depth scales linearly with diffusion length: a light polish of a few μm does not remove the tin; in the example, about 15 μm must be removed to bring it below 0.02 wt%.
- Before high-temperature bake of low-iron glass in air, confirm tin-side orientation to avoid “tin haze”.
- Face-to-face differences in adhesion, damp-heat durability and mould spots have no universal conclusion and must be tested with the plant process.
- Incoming inspection should check defects by face: tin side for roll marks and tin stickers, air side for tin drip-down.
- Use only one coating face per batch and write it into the process card.
Summary
The tin side carries a tin diffusion layer a few to more than ten micrometres deep that the air side does not, and it can be identified by 254 nm UV fluorescence. The example erfc profile shows that about 15 μm must be ground away before the tin falls to a very low level. Tin content and fluorescence are reliable; haze on heating and defect types must be checked by face; adhesion and durability have no universal conclusion. Choosing one face, fixing it, and verifying it with your own process is more reliable than quoting someone else’s result.
Translated from the ENC7 Chinese technical library (article 0567). Read the Chinese original. Need a disc built to your drawing? Request a quote or see our custom encoder discs.
© Langfang Jingzheng Optoelectronic Technology Co., Ltd. All rights reserved. This article was created with AI assistance.