Glass & substrate science
Glass Viscosity Curve: Strain, Annealing and Softening Points
Glass viscosity follows the VFT equation with temperature, and the strain, annealing and softening points correspond to fixed viscosities. This article fits the curves of soda-lime and borosilicate glass from three points, converts them into relaxation time and creep, and explains why coating, baking and curing temperatures must stay below the strain point with a safety margin.
Glass has no fixed melting point; whether it is “hard” or “soft” is the result of a continuously changing viscosity. Disc substrates go through resist baking, coating and adhesive curing, and some also through local heating — what sets the upper temperature limit of these steps? The answer lies on the viscosity–temperature curve: the strain, annealing and softening points given in glass handbooks are three fixed viscosity marks on this curve. This article computes the curve with the VFT equation and converts it into quantities that can be used directly for dimensional stability.
Three characteristic temperatures
By standard methods, the characteristic temperatures are defined at fixed viscosities (Pa·s in the table below; older literature uses poise or dPa·s, 1 Pa·s = 10 poise, and the strain point is often written as 10¹⁴·⁵ poise):
| Characteristic point | Viscosity η (Pa·s) | Soda-lime (example) | Type 3.3 borosilicate (example) |
|---|---|---|---|
| Working point | 10³ | approx. 1005 ℃ | approx. 1252 ℃ |
| Softening point (Littleton) | 10⁶·⁶ | approx. 726 ℃ | approx. 820 ℃ |
| Annealing point | 10¹² | approx. 546 ℃ | approx. 560 ℃ |
| Strain point | 10¹³·⁵ | approx. 514 ℃ | approx. 510 ℃ |
The softening point is the temperature at which glass deforms visibly under its own weight; near the annealing point internal stress relaxes noticeably within minutes; below the strain point stress is essentially “frozen” on practical time scales. The values are typical handbook values; for actual grades use the supplier’s data.
The VFT equation and three-point fit
The viscosity–temperature relation of supercooled liquids is commonly described by the Vogel–Fulcher–Tammann equation:
lg η = A + B / (T − T₀)
where η is in Pa·s, T is the temperature (expressed in ℃ in this article, T₀ in the same unit), A, B and T₀ are fit parameters, and T₀ is the temperature at which viscosity diverges. Solving exactly through the annealing, softening and working points gives:
| Glass | A | B | T₀ | Predicted strain point | Handbook strain point |
|---|---|---|---|---|---|
| Soda-lime | −3.79 | 5471 | 200 ℃ | 516 ℃ | approx. 514 ℃ |
| Borosilicate | −3.03 | 6970 | 96 ℃ | 518 ℃ | approx. 510 ℃ |
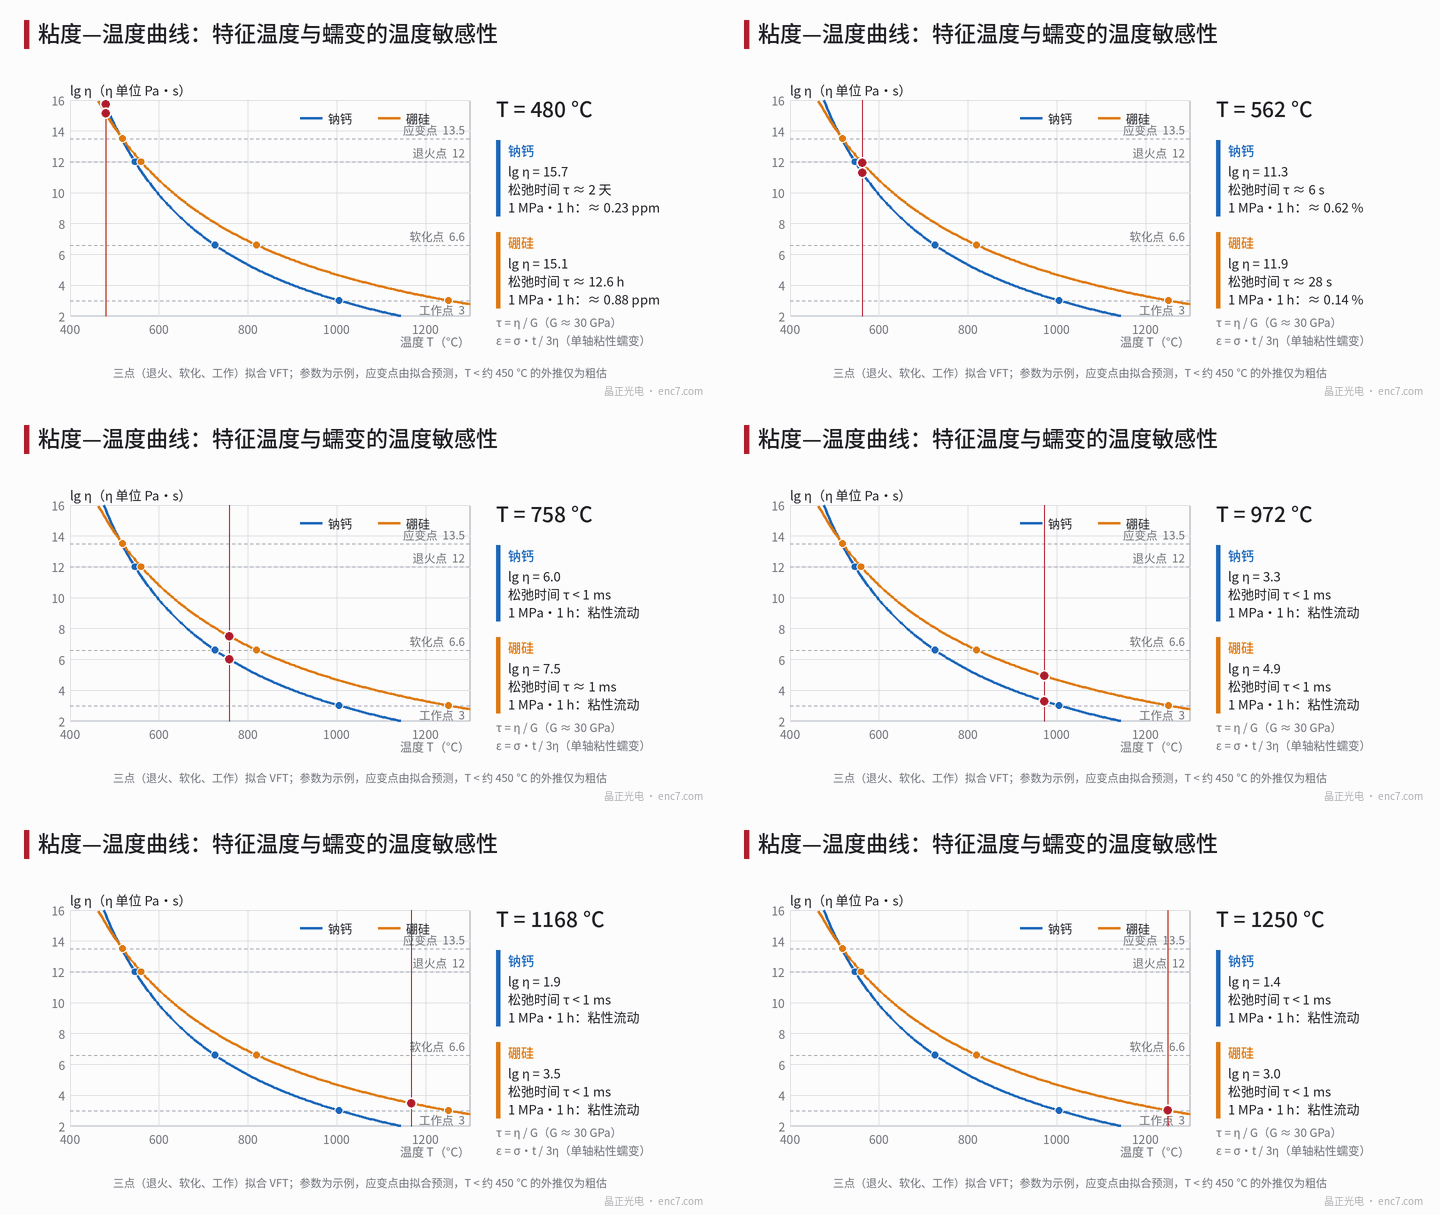
Without using the strain-point data, the prediction is still within 10 K of the handbook, showing that the three-parameter form is sufficient for this part of the curve. The slope of the curve is d(lg η)/dT = B/(T − T₀)²; at the strain point it is about 0.055 /K for soda-lime, i.e. viscosity drops by one decade for every 18 K rise and to about 1/3.6 for every 10 K; for borosilicate it is about 0.040 /K, one decade per 25 K. A small change in temperature corresponds to an exponential change in viscosity, which is why process temperatures must be strictly controlled.
From viscosity to relaxation time and creep
Viscosity by itself is not intuitive; two derived quantities are more useful. The Maxwell relaxation time is τ = η / G, where G is the shear modulus, taken as about 30 GPa; at the strain point τ ≈ 10¹³·⁵ ÷ 3×10¹⁰ ≈ 18 min, at the annealing point about 33 s. The viscous creep rate under uniaxial stress σ is σ/(3η), so after a hold time t the strain is
ε = σ·t / (3η)
With σ = 1 MPa (comparable in magnitude to stresses from clamping force, adhesive shrinkage or temperature gradients) and t = 1 h, the VFT fit above gives:
| Temperature | Soda-lime: lg η | Soda-lime: ε | Borosilicate: ε |
|---|---|---|---|
| 450 ℃ | 18.1 | 0.001 ppm | 0.03 ppm |
| 480 ℃ | 15.7 | 0.23 ppm | 0.9 ppm |
| 500 ℃ | 14.4 | 4.6 ppm | 7 ppm |
| 514 ℃ | 13.6 | 30 ppm | 27 ppm |
| 530 ℃ | 12.8 | approx. 210 ppm | approx. 110 ppm |
| 550 ℃ | 11.8 | approx. 1800 ppm | approx. 560 ppm |
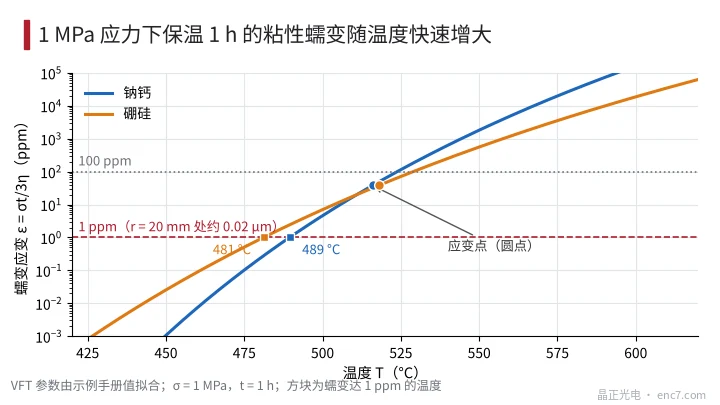
Between 480 ℃ and 550 ℃ — only 70 K apart — the creep changes by nearly four orders of magnitude. At r = 20 mm, 1 ppm of radial dimensional change is about 0.02 μm; creep reaches 1 ppm at about 490 ℃ for soda-lime and about 481 ℃ for borosilicate, 25–35 K below the strain point.
Two caveats. First, VFT describes the equilibrium supercooled liquid; below the transition temperature (roughly near the annealing point) the structure is no longer in equilibrium, the actual viscosity falls more slowly than the extrapolation, and it also depends on thermal history; rapidly cooled glass has a high fictive temperature and relaxes faster at the same temperature than the equilibrium extrapolation suggests. VFT extrapolation below the strain point therefore gives optimistic creep values, to be read only as a lower bound. Second, creep is plasticity under stress and is not the same thing as volume structural relaxation below the transition temperature (shrinkage of a few ppm after heat treatment), which is discussed in a separate article.
How to set the upper limit of process temperatures
Compare the process types in Figure 3 with the strain point: photoresist pre- and post-baking is generally at 90–130 ℃, adhesive curing generally at 80–150 ℃, and substrate heating during coating commonly around 300 ℃ (example). These are more than 160 K away from the strain points of soda-lime and borosilicate, so viscous creep can be disregarded; stress comes mainly from thermal-expansion mismatch and temperature gradients, not from viscous flow.
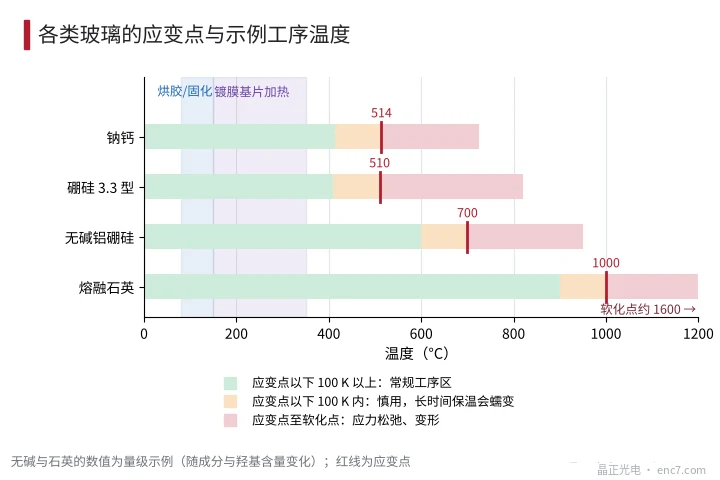
Viscosity really matters in three situations. First, steps such as stress-relief annealing or thermal bending deliberately go above the strain point and must be designed with a hold near the annealing point and slow cooling. Second, local heating, such as the heat-affected zone of laser processing, briefly exceeds the strain point and leaves residual stress after cooling. Third, in baking with uneven temperature distribution, the hot zone enters the relaxation range: stress is released during heating and rebuilt in a new state during cooling, so the warp gets “locked in”. For processes with long holds (several hours), taking at least 100 K below the strain point as the normal upper limit per Figure 3 leaves margin for the non-equilibrium extrapolation.
Engineering checklist
- When consulting glass handbooks, note the strain, annealing and softening points together with the measurement standard; temperatures from different standards can differ by a few degrees.
- Fit VFT to three known points and check whether a fourth point (e.g. the strain point) agrees; only use it for intermediate temperatures if it agrees within 10 K.
- For processes with long holds, set the upper limit at least 100 K below the strain point; short, fast processes can be relaxed somewhat, but temperature uniformity must be controlled.
- Near the strain point viscosity drops to about 1/3 for every 10 K rise (soda-lime); specify temperature-control tolerances according to this sensitivity.
- Local heat sources (laser, welding) exceed the strain point in their surroundings and leave residual stress after cutting, to be combined with annealing.
- Estimate creep with σ·t/3η: first estimate the magnitude of clamping or adhesive-layer stress, then judge whether the process is safe.
- VFT extrapolation below the transition temperature is optimistic; use conclusions only for ranking and margin design, not as exact predictions.
Summary
Glass viscosity varies exponentially with temperature, and the strain, annealing and softening points are fixed marks on this curve. The VFT equation fitted to three points shows that for soda-lime glass creep changes by nearly four orders of magnitude between 480 ℃ and 550 ℃. Normal baking, curing and coating are therefore far below the strain point, whereas hot forming and local heating must be designed according to the viscosity window.
Translated from the ENC7 Chinese technical library (article 0562). Read the Chinese original. Need a disc built to your drawing? Request a quote or see our custom encoder discs.
© Langfang Jingzheng Optoelectronic Technology Co., Ltd. All rights reserved. This article was created with AI assistance.