Glass & substrate science
How Glass Composition Sets Thermal Expansion: Oxide Additivity
The coefficient of thermal expansion of silicate glasses can be estimated by adding up oxide contributions. This article applies the molar-fraction additivity method to soda-lime, borosilicate, alkali aluminosilicate and alkali-free glass, compares the results with handbook values and a regression model, explains structurally why alkalis raise expansion while SiO₂ and Al₂O₃ lower it, and estimates how composition variation affects lot-to-lot expansion differences.
At incoming inspection, the CTE given by the supplier is often just a nominal value, for example about 9 for soda-lime glass and about 3.3 for borosilicate glass (unit 10⁻⁶/K). Different melts of the same grade vary in composition by a few parts per thousand — how much does the CTE differ, and how large is that difference in the fit between disc and hub? Without experiments, the oxide additivity method gives a first order-of-magnitude estimate: many glass properties are approximately a linear sum of the contributions of the individual oxides, and the CTE is one of the more regular ones.
The additivity method: model and coefficients
The Appen-type additivity method calculates by molar fraction:
α = Σ xᵢ·aᵢ
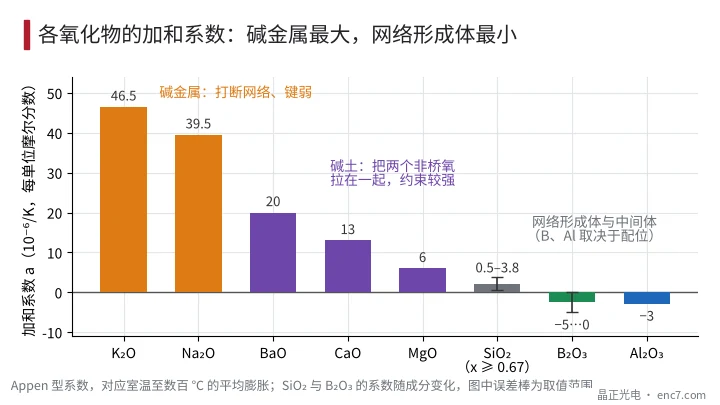
where xᵢ is the molar fraction of the i-th oxide and aᵢ its additivity coefficient (unit 10⁻⁶/K, corresponding to the mean expansion from room temperature to several hundred ℃). Commonly published coefficients are: Na₂O about 39.5, K₂O about 46.5, BaO about 20, CaO about 13, MgO about 6, Al₂O₃ about −3. The SiO₂ coefficient depends on its content: for a molar fraction x ≥ 0.67 it is 10.5 − 10x (pure SiO₂ gives 0.5), for x < 0.67 it is 3.8. The B₂O₃ coefficient varies strongly with composition; the literature gives a range of −5 to 0, so only a range or a mid value can be used.
Compositions are usually given in mass fractions and must be converted first: xᵢ ∝ wᵢ / Mᵢ (Mᵢ being the molar mass), then normalised. The other family, the Winkelmann–Schott method, adds mass fractions directly; it is cruder and deviates noticeably for glasses rich in BaO and Al₂O₃ (in the examples here it overestimates alkali-free glass by about 2 units; not recommended).
Numerical example
All compositions below are typical examples and do not correspond to any specific grade. Soda-lime glass (wt%): SiO₂ 72.6, Na₂O 13.9, CaO 8.4, MgO 4.0, Al₂O₃ 0.7, K₂O 0.4, which converts to molar percentages of 71.4, 13.2, 8.8, 5.9, 0.4, 0.3. The SiO₂ coefficient is then 10.5 − 7.14 = 3.36, and the contributions are:
| Oxide | Molar fraction | Coefficient | Contribution |
|---|---|---|---|
| SiO₂ | 0.714 | 3.36 | 2.40 |
| Na₂O | 0.132 | 39.5 | 5.23 |
| CaO | 0.088 | 13 | 1.15 |
| MgO | 0.059 | 6 | 0.35 |
| K₂O | 0.003 | 46.5 | 0.12 |
| Al₂O₃ | 0.004 | −3 | −0.01 |
| Total | 9.24 |
The handbook range is about 8.5–9.5, so this agrees. Na₂O alone accounts for more than half.
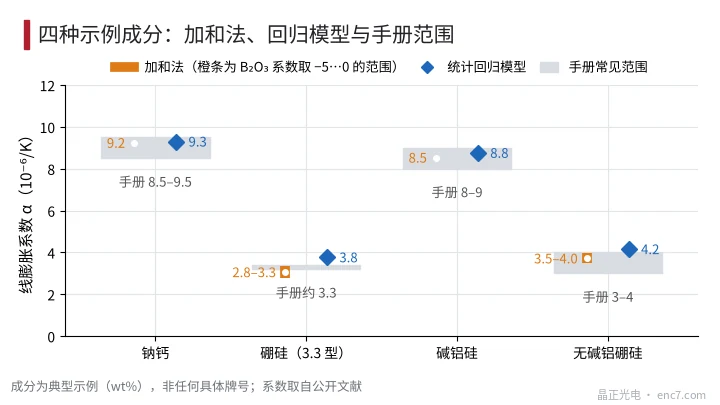
The four example compositions compare as follows (see Figure 2):
| Glass (example) | Additivity method | Regression model | Common handbook range |
|---|---|---|---|
| Soda-lime | 9.2 | 9.3 | 8.5–9.5 |
| Borosilicate (81/13/4/2: SiO₂/B₂O₃/Na₂O/Al₂O₃) | 3.1 (2.8–3.3) | 3.8 | approx. 3.3 |
| Alkali aluminosilicate | 8.5 | 8.8 | 8–9 |
| Alkali-free aluminoborosilicate | 3.7 (3.5–4.0) | 4.2 | 3–4 |
Values in brackets are the range for a B₂O₃ coefficient of −5 to 0. The regression model is the global statistical model with quadratic and interaction terms proposed by Fluegel; it refers to the CTE around 210 ℃, its reported standard error is about 0.4, and the author states its accuracy is about twice that of earlier additivity methods. For boron-containing glasses the two methods differ by 0.4–0.7, precisely because of the “boron anomaly” of B₂O₃: the fixed coefficients of the additivity method cannot describe how boron coordination changes with composition.
Structural reasons: why alkalis raise expansion and network formers lower it
Fused silica is a three-dimensional network of Si–O tetrahedra linked by bridging oxygens; the bonds are strong and the network is open, and on heating the transverse vibration of the oxygen atoms even offsets part of the bond-length expansion, so its CTE is only about 0.5.
Adding Na₂O breaks bridging oxygens into non-bridging oxygens; Na⁺ occupies the network interstices with a much weaker ionic bond, the bond anharmonicity is large, the network connectivity drops, and expansion rises accordingly. Alkaline-earth ions (Ca²⁺, Mg²⁺) have higher charge and field strength and can pull two non-bridging oxygens together, acting as local cross-links; their coefficients are therefore smaller than those of the alkalis, with Mg smaller than Ca, i.e. at the same molar fraction they raise expansion less.
In the presence of alkali, Al₂O₃ enters the network as AlO₄⁻ tetrahedra charge-compensated by Na⁺, turning non-bridging oxygens back into bridging ones, so its coefficient is slightly negative. B₂O₃ exists in both three- and four-fold coordination, in proportions that change with alkali content — which is why its coefficient is not fixed (Figure 3).
Effect of composition variation on lot-to-lot expansion difference
A sensitivity analysis with the Appen coefficients: for every 0.5 wt% of SiO₂ replaced by the following oxides, the CTE changes by:
| Oxide substituted | Soda-lime glass | Borosilicate glass |
|---|---|---|
| Na₂O | +0.21 | +0.23 |
| K₂O | +0.17 | +0.18 |
| CaO | +0.09 | +0.10 |
| Al₂O₃ | +0.02 | +0.01 |
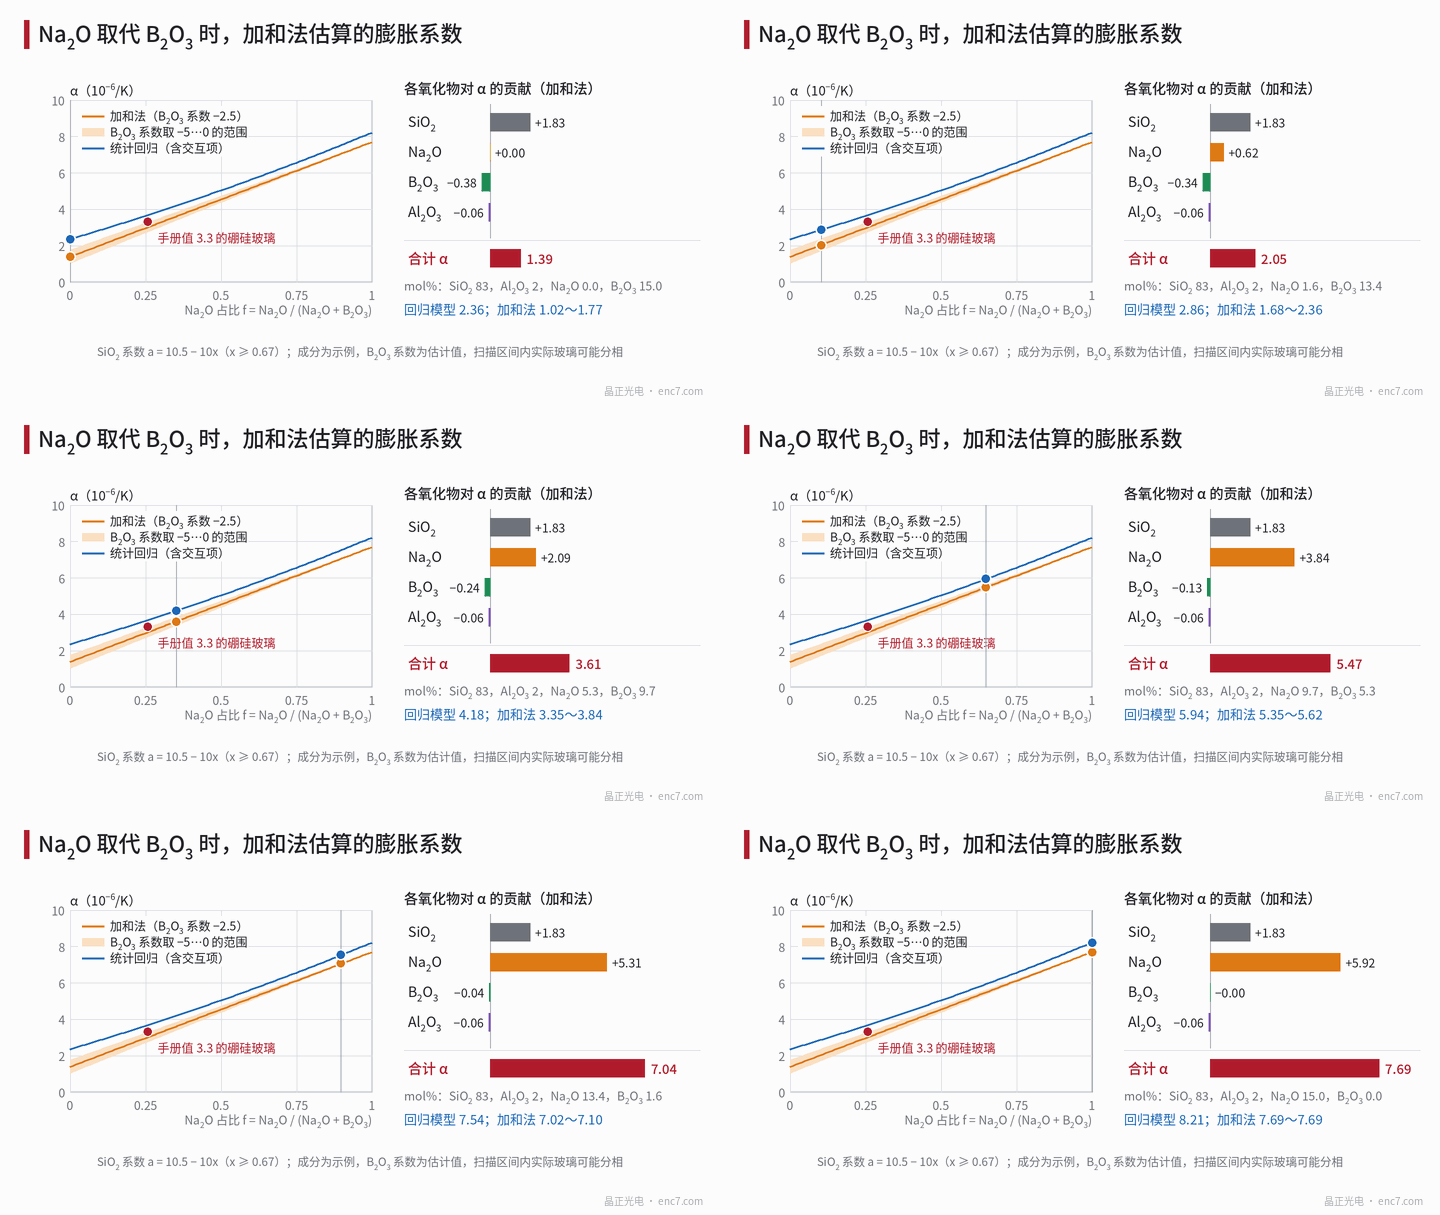
Each 1 wt% of Na₂O changes α by about 0.4–0.45. If the Na₂O of a borosilicate lot varies by ±0.5 wt%, α varies by about ±0.23, i.e. 7% of 3.1; the same variation in soda-lime glass is only 2% of 9.2. Converted to dimensions: at r = 20 mm and a temperature rise of 60 K, Δr = r·Δα·ΔT ≈ 0.27 μm. Uniform expansion does not change the angular positions of the lines and causes no pitch mismatch; what this quantity really affects is the expansion difference against a metal hub. For example, stainless steel (about 16.5) and soda-lime glass (about 9.2) differ by 10 × 7.3×10⁻⁶ × 60 ≈ 4.4 μm at a mating surface at r = 10 mm, and the lot-to-lot variation is only a few percent of that.
So estimating from composition is mainly useful for two things: judging whether a supplier’s nominal value is plausible, and assessing the order of magnitude of the expansion difference when changing material or melt. Exact values require measurement.
Engineering checklist
- The additivity method is suited to estimating magnitudes and trends; for boron-containing glasses give a range, not a single value.
- Convert mass fractions to molar fractions before estimating, normalising wᵢ/Mᵢ; mixing the two bases gives wrong results.
- The expansion of soda-lime glass is dominated by Na₂O, about 0.4 per 1 wt%; when checking lot consistency, ask the supplier for lot data on Na₂O content or CTE.
- Base the material pairing of disc and hub on measured or handbook values; lot variation is generally only a correction of a few percent.
- Estimates for alkali-free aluminoborosilicate glass can be off by about 0.5; do not select by formula alone — look at the test report.
- Align temperature ranges: handbooks mostly give the 20–300 ℃ mean, while the regression model compared with the additivity method refers to around 210 ℃, so a direct comparison has a basis difference.
Summary
The CTE of glass can be estimated by molar-fraction additivity: about 9.2 for soda-lime glass and about 3.1 (range 2.8–3.3) for borosilicate glass, broadly agreeing with handbooks. Alkalis break up the network and raise expansion, SiO₂ and Al₂O₃ strengthen the network and lower it, and the effect of B₂O₃ depends on its coordination. Each 1 wt% of Na₂O changes α by about 0.4; with this coefficient the expansion difference between lots can be estimated.
Translated from the ENC7 Chinese technical library (article 0561). Read the Chinese original. Need a disc built to your drawing? Request a quote or see our custom encoder discs.
© Langfang Jingzheng Optoelectronic Technology Co., Ltd. All rights reserved. This article was created with AI assistance.