Glass & substrate science
How Much Light Ordinary Glass Loses at 850–950 nm Because of Iron
Ferrous iron in glass has a broad absorption band near 1075 nm whose tail enters the 850–950 nm readout band. Using the Beer–Lambert law this article estimates transmittance differences among ordinary soda-lime, low-iron and borosilicate glasses (example: about 5 percentage points at 2 mm, 940 nm) and explains the effect on amplitude and lot-to-lot consistency.
The most common light source for transmission glass encoder discs is an 850 nm or 940 nm infrared LED. Glass itself looks “transparent”, so few people bother to compute how much light it absorbs. Ordinary soda-lime glass, however, contains about one part per thousand of iron oxide; the ferrous iron has a broad near-IR absorption band peaking at 1000–1100 nm, and the short-wavelength tail exactly enters the readout band. Same pattern, same readhead, different glass — photocurrent can differ by several percent. How large is that difference, and does it hurt accuracy? This article works it out with the Beer–Lambert law.
Model: absorption coefficient and transmittance
Light through a uniformly absorbing medium of thickness t has internal transmittance
τ = exp(−α·t), α = ln10 · ε · c
where α is the absorption coefficient (cm⁻¹), ε the molar extinction coefficient of ferrous iron (L·mol⁻¹·cm⁻¹) and c the ferrous molar concentration (mol/L). c is obtained from iron-oxide mass fraction w, glass density ρ and the ferrous share of total iron r:
c = w · ρ · 1000 / 159.69 · 2 · r
where 159.69 g/mol is the molar mass of Fe₂O₃ and each molecule holds 2 iron atoms. Ferric absorption lies mainly in the UV and blue and barely affects 850–950 nm, so the near-IR band looks only at ferrous iron.
Plate total transmittance also includes reflection at both surfaces:
T = (1 − R)²·τ / (1 − R²τ²), R = ((n − 1)/(n + 1))²
At n = 1.51, R ≈ 4.1% and with no absorption T is about 92%. That 8% reflection loss is the same on all glasses; below we compare only the difference due to iron absorption.
Worked example: ordinary soda-lime versus low-iron glass
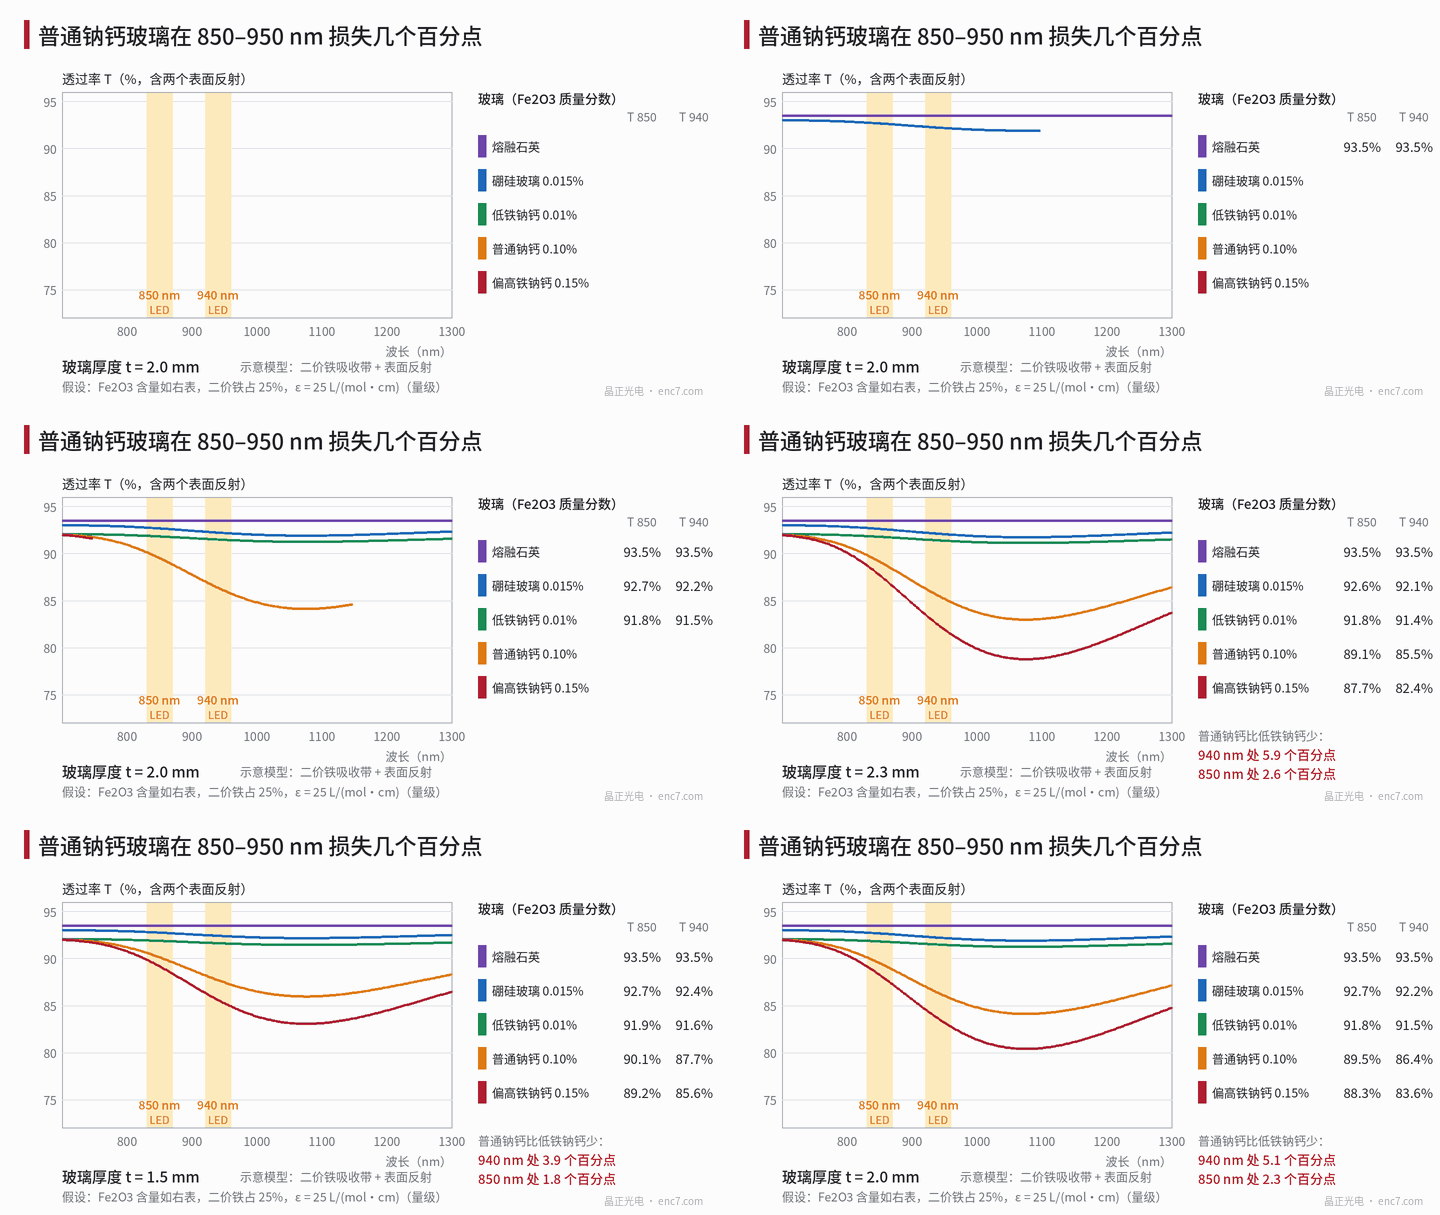
Assumptions: ferrous share 25%, peak ε = 25 L·mol⁻¹·cm⁻¹ (literature varies within this order with glass composition), spectral shape a Gaussian in wavenumber space (centre about 9300 cm⁻¹, i.e. 1075 nm, half-width 3800 cm⁻¹). For ordinary soda-lime w = 0.10%, ρ = 2.5 g/cm³, c ≈ 7.8 mmol/L, peak α ≈ 0.45 cm⁻¹, about 0.14 cm⁻¹ at 850 nm and about 0.32 cm⁻¹ at 940 nm. At 2 mm thickness:
- 850 nm: τ = exp(−0.14×0.2) ≈ 97.2%
- 940 nm: τ = exp(−0.32×0.2) ≈ 93.8%
Total transmittance computed for several glasses (including reflection, n taken as 1.45–1.51):
| Glass (Fe₂O₃ mass fraction, example) | 1 mm, 850 / 940 nm | 2 mm, 850 / 940 nm |
|---|---|---|
| Ordinary soda-lime (0.10%) | 90.8% / 89.2% | 89.5% / 86.4% |
| Higher-iron soda-lime (0.15%) | 90.1% / 87.7% | 88.3% / 83.6% |
| Low-iron soda-lime (0.01%) | 91.9% / 91.8% | 91.8% / 91.5% |
| Borosilicate (0.015%) | 92.8% / 92.6% | 92.7% / 92.2% |
| Fused silica (iron negligible) | 93.5% / 93.5% | 93.5% / 93.5% |
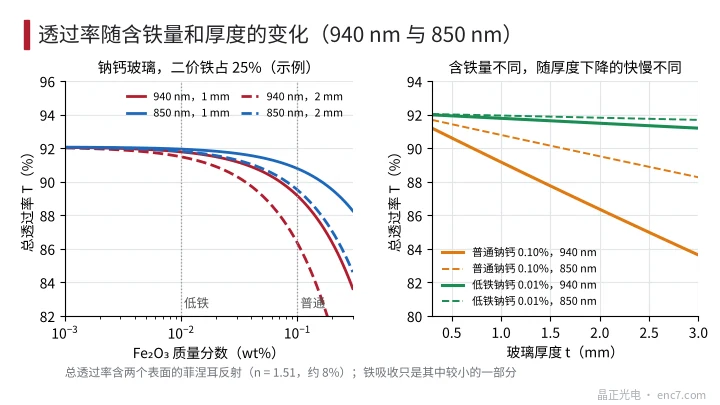
At 2 mm and 940 nm, ordinary soda-lime is about 5 percentage points below low-iron soda-lime (about 6% relatively); at 850 nm the gap is only about 2.3 points. The reason is that the band tail strengthens as wavelength approaches the peak: in the model, α at 940 nm is 2.3× that at 850 nm. Halving thickness roughly halves the difference (Figure 2).
What it means for the signal
Overall amplitude scales; contrast is unchanged. Absorption is neutral attenuation: bright and dark states both scale by T, so modulation M = (Imax − Imin)/(Imax + Imin) is unchanged, and interpolation uses the sine-to-cosine ratio, which is also unchanged. Iron absorption therefore affects signal amplitude and SNR, not angular accuracy.
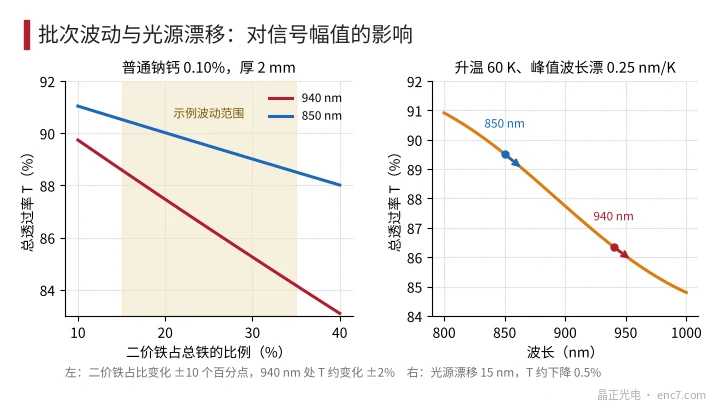
Lot consistency. Fe₂O₃ of one grade fluctuating ±20% (0.08%–0.12%) moves T at 2 mm, 940 nm by about ±1.1 points; melt atmosphere shifting ferrous share between 15% and 35% moves T by about ±2.2 points. Stacked, that is a few percent of amplitude scatter — usually less than LED binning and photodiode scatter, but fixed-gain circuits without AGC need headroom.
Temperature. LED peak wavelength drifts about 0.2–0.3 nm/K; a 60 K rise drifts about 15 nm, and for ordinary soda-lime 2 mm T falls by about 0.5 points near both 850 nm and 940 nm (Figure 3) — negligible.
For reflective discs or glass with a back-side coating, light makes a round trip through the glass and absorption loss is squared: at 940 nm, τ of 2 mm ordinary soda-lime goes from 93.8% to 88.0%.
Engineering notes
- At 940 nm with ordinary soda-lime, 2 mm thickness loses about 6% extra light; switching to 850 nm or low-iron glass brings it below 3%.
- Incoming inspection: measure the 1050 nm / 700 nm transmittance ratio on a spectrophotometer; α = −ln(T₁₀₅₀/T₇₀₀)/t gives band strength directly.
- Extrapolating from 1050 nm to 850/940 nm needs the measured spectrum of the same glass family for the ratio — do not reuse another maker’s shape.
- Spec sheets should state substrate grade, Fe₂O₃ upper limit and transmittance at the design wavelength — more controllable than “transparent” alone.
- Fixed-gain circuits with tight amplitude budgets: leave margin for ±2%–3% glass-lot transmittance scatter.
- Thin where you can: absorption accumulates exponentially with thickness; 1 mm versus 2 mm halves the loss.
Summary
The ferrous absorption band costs ordinary soda-lime about 6% of the light at 940 nm in 2 mm thickness, about 3% at 850 nm; low-iron and borosilicate fall below 1%. The loss is neutral attenuation — it changes amplitude only, not modulation or the interpolation ratio — and affects SNR and lot consistency. Absorption coefficient and spectral shape vary with glass composition; numbers here are example orders of magnitude — check against the actual glass spectrum before freezing the design.
Translated from the ENC7 Chinese technical library (article 0573). Read the Chinese original. Need a disc built to your drawing? Request a quote or see our custom encoder discs.
© Langfang Jingzheng Optoelectronic Technology Co., Ltd. All rights reserved. This article was created with AI assistance.