Testing, reliability & quality
Measurement Uncertainty of Encoder Disc Parameters: Line Width, Optical Density and Eccentricity

Line width, optical density and eccentricity are the three core parameters in encoder disc inspection. Following the GUM method, this article breaks down the main uncertainty sources of each, gives quantitative formulas for edge-threshold bias, stray-light background and first-harmonic fitting, and uses worked examples to show how uncertainty eats into the tolerance.
A disc with a specified line width of 25 μm ±1 μm reads 25.6 μm on a vision measuring machine – accept or reject? If the same instrument would read 25.0 μm or 26.2 μm with a different edge algorithm, then “25.6” on its own carries little information. Before inspection data can be used for a decision, you first have to answer how large the uncertainty of the result is and what share of the tolerance it takes.
Evaluation framework: the four GUM steps
Following the Guide to the Expression of Uncertainty in Measurement (GUM), the evaluation has four steps:
- Write down the measurement model y = f(x₁, x₂, …, x_n), listing every influence quantity as an input.
- Evaluate the standard uncertainty u_i of each input: obtained statistically from repeated measurements it is Type A; obtained from an interval given by certificates, handbooks or experience with an assumed distribution it is Type B. If all you know is that the error lies uniformly within ±a, then u = a/√3.
- Combine: u_c = √(Σ c_i²·u_i²), where c_i is the sensitivity coefficient (∂f/∂x_i); if inputs are correlated, covariance terms must be added.
- Expand: U = k·u_c, usually with k = 2, corresponding to a coverage probability of about 95%.
The key is step 1: if the model misses an influence quantity, no amount of care later on will prevent an underestimate.
Line width: edge detection is the big item
Measuring line width optically essentially means finding two edges in a grey-level profile. The imaging system blurs, so the sharp edge of a chrome line becomes a ramp in the image. Approximating the blur as a Gaussian with standard deviation σ, and with the line width much larger than σ, detecting the edges at a normalised threshold t gives a measured width of:
w_m = w + 2σ·z(t)
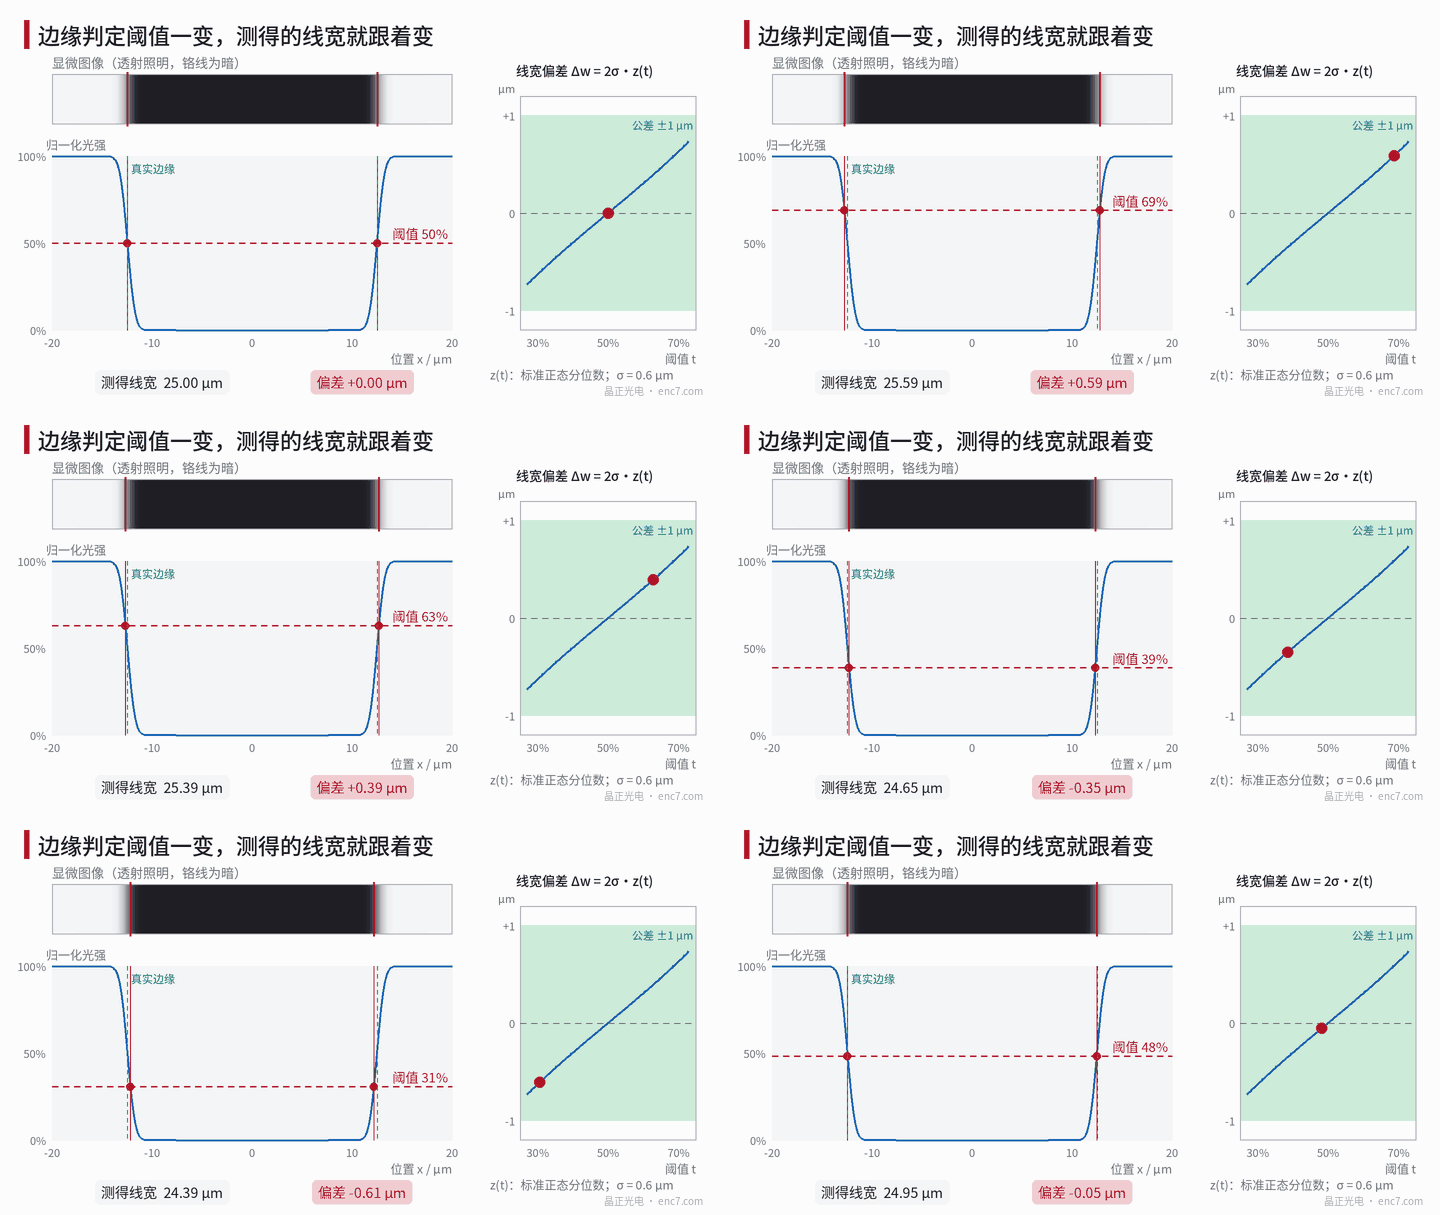
where w is the true line width and z(t) is the t-quantile of the standard normal distribution (dark line on a bright background; values below the threshold count as line). At t = 50% z = 0 and there is no bias; with σ = 0.6 μm, t = 40% gives −0.30 μm and t = 70% gives +0.63 μm, see Figure 1.
This shows two things. First, if instruments or software use different threshold conventions, their data are not comparable. Second, even with a fixed 50% the “optical edge” is not necessarily the “geometric edge” defined on the drawing: the chrome sidewall slope, illumination coherence and defocus all make the profile asymmetric. Until it has been calibrated against a line-width reference standard, this bias can only be estimated as an interval.
Other sources:
- Pixel scale calibration: calibrated with a reference scale; a relative uncertainty of 0.1% contributes only 0.025 μm to a 25 μm line width, but for long dimensions such as diameter or pitch the same relative amount becomes a dominant term.
- Temperature: a 25 μm line on borosilicate glass changes by about 0.0002 μm for a 2 K deviation from 20 ℃ – negligible; a 40 mm outer diameter, however, changes by about 0.26 μm and must be accounted for when measuring the outer diameter.
- Repeatability: measure the same position 10 times and take the single-measurement standard deviation as the Type A component.
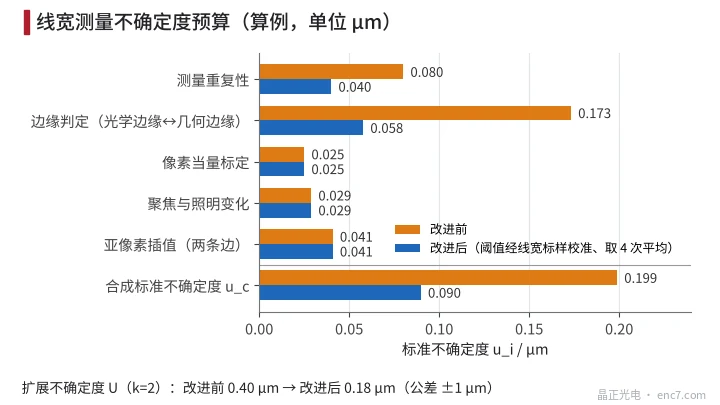
Figure 2 shows a worked budget (hypothetical data): before improvement, with edge detection taken as a ±0.30 μm rectangular distribution, u_c ≈ 0.20 μm and U ≈ 0.40 μm; after calibrating the threshold bias to ±0.10 μm with a line-width standard and averaging 4 readings, U ≈ 0.18 μm.
Optical density: the background sets the ceiling
OD = −lg(I_t / I₀), where I_t is the transmitted light and I₀ the reference light. Random noise propagates as:
u(OD) = 0.434·√[(u(I_t)/I_t)² + (u(I₀)/I₀)²]
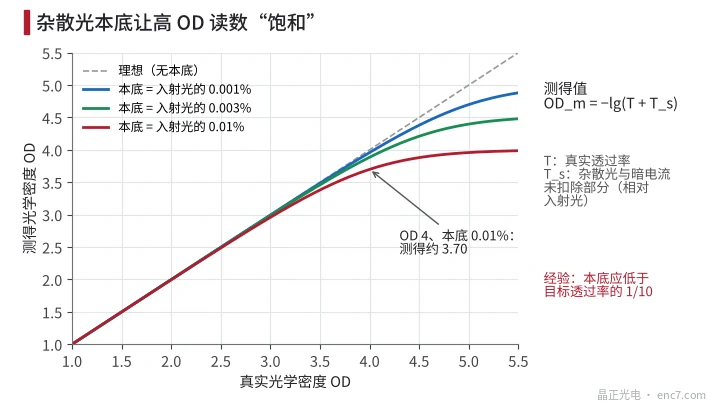
With 1% relative noise on the transmitted light I_t and negligible noise on the reference I₀, the uncertainty of OD is only about 0.004 – not much. The real problem is a systematic background: stray light, detector dark current, bypass light that is not fully blocked. If the background corresponds to a fraction T_s of the incident light, the measured value is OD_m = −lg(T + T_s). With T_s = 0.01%, OD 3 reads as 2.96 and OD 4 can only be read as about 3.70, see Figure 3. High-OD measurement must therefore first measure and subtract the “fully blocked” reading, and the residual background should be below 1/10 of the target transmittance. OD also depends on wavelength, so the measuring wavelength should be close to that of the readhead light source.
Eccentricity: the difference between two first-harmonic fits
Disc eccentricity usually means the offset of the pattern centre (centring ring) from the mounting reference (bore). A common method puts the disc on a precision air-bearing rotary table; a camera takes N equally spaced points per revolution, giving the radial positions of the centring ring and of the bore edge, and each is fitted with
r(θ) = r₀ + a·cosθ + b·sinθ
Subtracting the two (a, b) pairs and taking the magnitude gives the eccentricity e of the pattern relative to the bore, independent of how far off-centre the disc was placed on the table; higher harmonics belong to roundness and are not counted as eccentricity. Small discs can also be measured on a vision measuring machine by fitting two circles directly and taking the distance between their centres.
With equally spaced sampling and single-point noise σ, the uncertainty of each e component from one fit is about σ·√(2/N); the difference of two fits multiplies this by √2. With σ = 0.3 μm and N = 36 this is about 0.1 μm. Rotary table radial error motion, burrs and out-of-roundness of the bore edge, and pixel scale must also be included. At r = 20 mm, an eccentricity uncertainty of 0.1 μm corresponds to an angular error of about 1″.
Measurement capability: what share of the tolerance the uncertainty takes
A common measure of measurement capability is the ratio of U to half the tolerance. As a rule of thumb it should not exceed 1/3; demanding applications use 1/5 or even 1/10.
In the line width example above the tolerance is ±1 μm: before improvement U = 0.40 μm, a ratio of 40% – the measurement system is not adequate; after improvement U = 0.18 μm, a ratio of 18%.
Uncertainty also directly narrows the range in which a decision can be made. Following ISO 14253-1, a supplier proving conformance needs a measured value within the tolerance zone narrowed by U at each end. Before improvement the conformance zone shrinks to ±0.60 μm; after improvement it is ±0.82 μm. In other words, reducing the measurement uncertainty from 0.40 to 0.18 μm gives the process about 0.22 μm of extra margin on each side.
Engineering points
- The threshold convention (50% or other) and the algorithm for line width measurement must be written into the inspection procedure and agreed by supplier and customer; otherwise differences can exceed 0.5 μm (with σ = 0.6 μm the span from 30% to 70% is 1.26 μm).
- Calibrate the “optical edge to geometric edge” bias regularly with a certified line-width reference standard; this is usually the dominant term in the line width budget.
- Relative errors scale with length: the same 0.1% scale or pixel-scale error is 0.025 μm on a 25 μm line but 40 μm on a 40 mm outer diameter, so for long dimensions calibration and temperature correction are the focus.
- For OD, measure and subtract the background first; the higher the target OD, the stricter the stray-light requirement – OD 4 needs a background below the 10⁻⁵ order.
- Eccentricity must be referenced to the bore: fit the centring ring and the bore together and use the difference of their first harmonics, with at least 36 points per revolution, and check the rotary table regularly with a reference artefact.
- Calculate the capability ratio before fixing the decision rules: if it exceeds 1/3, improve the measurement before tightening the process.
Summary
The value of disc inspection data depends on its uncertainty. For line width the main source is edge detection, for OD it is the background, and for eccentricity it is the spindle and fitting noise. Only when these sources are quantified, calibrated and kept within 1/3 of half the tolerance will inspection results stand up to review by both supplier and customer.
Translated from the ENC7 Chinese technical library (article 0191). Read the Chinese original. Need a disc built to your drawing? Request a quote or see our custom encoder discs.
© Langfang Jingzheng Optoelectronic Technology Co., Ltd. All rights reserved. This article was created with AI assistance.