Encoder-disc terminology
Mounting Gap: Reference Surfaces and Gap-Tolerance Definitions
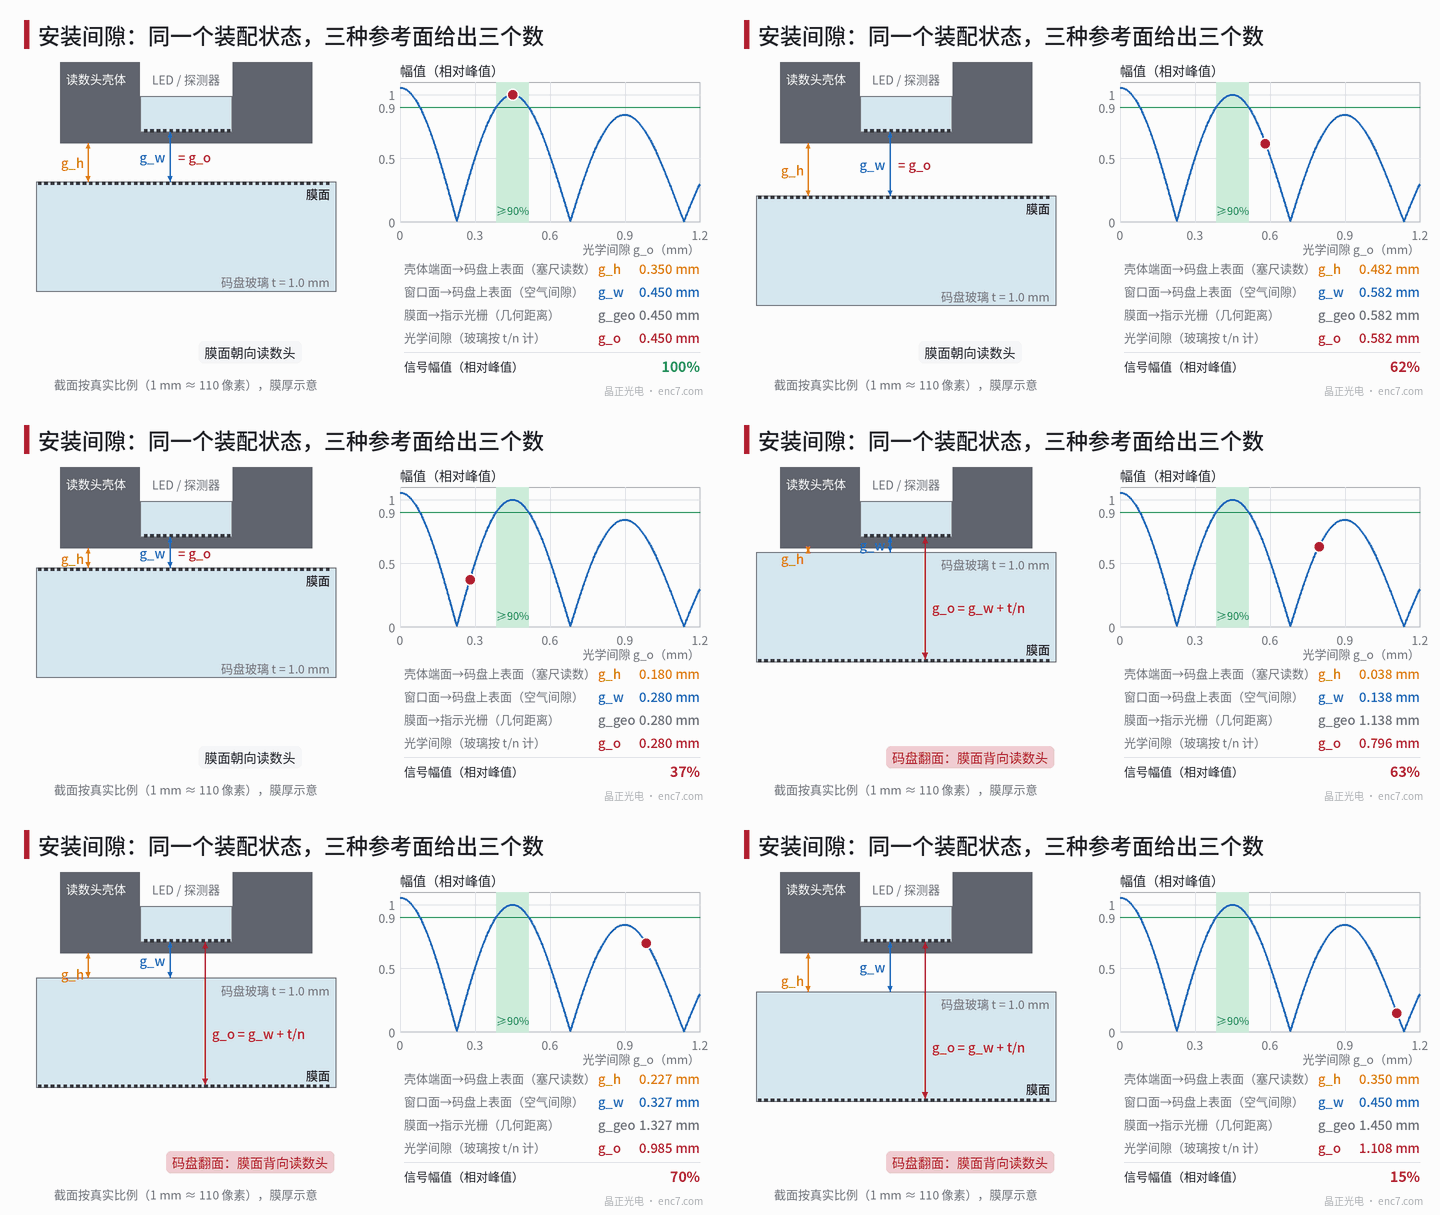
The gap can be measured from the pattern side, from the upper surface of the disc or from the readhead housing face, and through glass it must be converted to an optical gap as t/n; the bases can differ by a whole glass thickness. This article gives the conversion formulas, compares five tolerance definitions (±65 μm to ±150 μm) on an amplitude–gap curve, and estimates the errors of three methods: feeler gauge, displacement sensor and amplitude scan.
The readhead manual says “gap 0.45 mm”. The fitter slides a feeler gauge between housing and disc, reads 0.45, and the signal is less than half of normal. On investigation, the manual’s 0.45 is from the pattern side to the index grating, while the feeler gauge measured from the housing face to the upper surface of the glass—between the two numbers lie a housing boss and an entire glass plate. The word “gap” has at least four bases, and tolerance can be defined in several ways; if the specification does not say which, each side talks past the other.
Four bases and their conversion
On the readhead side three surfaces can be taken: the housing face (mechanical datum, often the most protruding), the outer surface of the window, and the optical surface on which the index grating or the detector lies. On the disc side two surfaces can be taken: the pattern side (where the chrome pattern is) and the disc surface facing the readhead. This gives four common bases:
- g_h: housing face to the near surface of the disc. This is what feeler gauges and shims measure, because it is the narrowest slot between the two physical parts.
- g_w: window surface to the near surface of the disc, i.e. the air gap in the optical path.
- g_geo: geometric distance from the pattern side to the optical surface, glass counted at its actual thickness.
- g_o: optical gap, glass counted as t/n.
In the paraxial approximation, propagation through glass of refractive index n and thickness t accumulates the same diffraction phase as propagation over t/n in air (the wavelength becomes λ/n), so the amplitude–gap curve of an imaging readhead responds only to g_o:
g_o = g_air + Σ t_i / n_i
where g_air is the air path between the two patterned surfaces and t_i, n_i are the thickness and refractive index of each glass plate traversed—including the disc substrate when the pattern side faces away from the readhead, and the window glass when the index grating is on the inside of the window. The chrome film is only of the order of a hundred nanometres and can be neglected.
For the example structure of Figure 1 (housing protrudes beyond the window by s = 0.10 mm, disc t = 1.0 mm, n = 1.52):
| Basis | Pattern side toward readhead | Pattern side away from readhead |
|---|---|---|
| g_h | g_o − 0.10 | g_o − 0.758 |
| g_w | g_o | g_o − 0.658 |
| g_geo | g_o | g_o + 0.342 |
With the pattern side facing away, g_geo and g_w differ by exactly one glass thickness, and g_geo and g_o differ by t(1 − 1/n) = 0.342 mm. If the design calls for g_o = 0.45 mm, after flipping, g_w would have to be −0.208 mm, which is physically impossible; if the disc is still assembled to g_w = 0.45, then g_o = 1.108 mm and on the example curve only about 15% of the amplitude remains. Whether the refractive index is taken as 1.47 or 1.52 changes t/n by only about 22 μm; the difference between bases is far larger than the difference between materials.
Defining tolerance from the amplitude–gap curve
The physical meaning of a gap tolerance is: within this gap range the signal amplitude stays above a given fraction. The example readhead works near the phase-reversed image plane at p²/λ ≈ 455 μm, and the amplitude varies as |cos(πλz/p²)·sinc(z·Δα/p)| (derivation in the Talbot-effect article in this library), peaking at 0.450 mm. The tolerances obtained from the same curve on different bases are shown in Figure 2:
| Basis | Gap range (mm) | Relative to peak |
|---|---|---|
| Amplitude ≥ 90% of peak | 0.385–0.515 | ±0.065 |
| Amplitude ≥ 80% of peak | 0.358–0.543 | −0.092 / +0.093 |
| −3 dB (20lg, amplitude ≥ 70.7%) | 0.337–0.564 | about ±0.113 |
| −3 dB wrongly taken as 10lg (amplitude ≥ 50%) | 0.301–0.602 | about ±0.150 |
| Amplitude ±10% around nominal 0.420 | 0.379–0.521 | relative to nominal −0.041 / +0.101 |
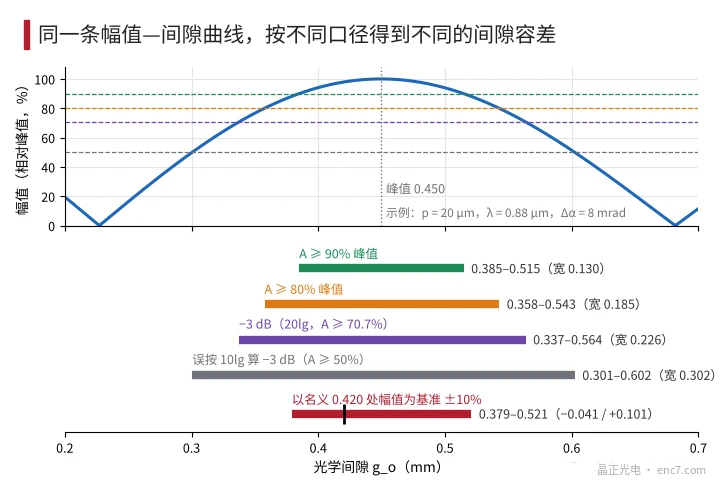
Three points deserve attention. First, “x%” must state whether it is relative to the peak or to the nominal point; when the nominal point is not at the peak, the tolerance band is asymmetric. Second, a decibel basis must state 20lg: a 3 dB drop in amplitude is 70.7%; read as power, 10lg, it becomes 50% and the tolerance is a third wider. Third, the curve must be measured at constant LED current; if the readhead has automatic gain or constant-light control, the amplitude appears unchanged, and the LED current or gain reading should be used for the definition instead.
The tolerance applies to the optical gap. On assembly, axial runout, warp, axial play and thermal deformation must be deducted, and only what remains is available to assembly (budgeting methods in the articles on axial runout and thickness tolerance in this library).
Measurement methods and their bases
Feeler gauge or plastic shims. These read g_h, and specifically the local minimum at the insertion point. Example errors (assumed): blade thickness tolerance about ±3 μm, steps of blade combinations about ±5 μm, feel about ±5–10 μm, insertion point not at the same angle as the reading window with 10 μm axial runout about ±5 μm, and converting to g_w also needs the tolerance of the housing protrusion s (assumed ±10 μm). The root-sum-square is about ±15 μm, a quarter of a ±65 μm window. A feeler gauge can also scratch an outward-facing pattern side and push a thin disc out of shape.
Displacement sensor. A contact probe touches the disc surface and the readhead datum in turn, and the gap is the difference; indication resolution can reach the sub-micrometre range, the main errors coming from datum transfer and from probing force pressing a thin disc down. Non-contact sensors depend on the surface: capacitive sensors respond only to the conductive chrome film; laser triangulation on transparent glass receives reflections from both surfaces and reads unstably; chromatic confocal sensors can separate the two glass surfaces, but near the axis the apparent thickness displayed is about t/n and must be corrected for the material’s refractive index—follow the sensor documentation for the exact factor.
Amplitude scan. Move the readhead axially on a fine-positioning stage and record the amplitude; this gives the optical basis directly. The peak is very flat: 1% amplitude repeatability corresponds to about ±20 μm uncertainty in peak position. Taking instead the midpoint of the two 90% crossings, where the slope is about 0.31%/μm, the same noise causes only about 3 μm of error. Calibrate the offset between mechanical datum and optical gap once with this method; afterwards the production line can measure g_h with a feeler gauge and convert.
Engineering points
- Write the gap in a specification as “from surface X to surface Y” and state whether glass is converted as t/n; the readhead drawing should give the distance from housing face to optical surface and its tolerance.
- The orientation of the pattern side decides whether an extra t/n appears—about 0.66 mm for 1 mm soda-lime glass, enough to move a fine-pitch readhead out of its entire window; the drawing must mark the pattern-side orientation.
- Give all three parts of a tolerance basis: relative to peak or to nominal, percentage or 20lg decibels, and the constant-LED-current condition; in the example the widths on the 90% and 50% bases differ by a factor of about 2.3.
- A feeler gauge measures the local minimum gap on the housing basis, with an example error of about ±15 μm; it suits quick go/no-go decisions on the line, not verification of a narrow window.
- When introducing a new readhead, use the amplitude scan and fix the optical zero at the midpoint of the two x% crossings; this is several times more accurate than finding the peak.
- When chromatic confocal or other optical distance sensors read through glass, the apparent thickness is about t/n; confirm before measuring whether the instrument already applies the refractive-index correction.
Summary
The mounting gap is a convention about “between which two surfaces, and how the glass is counted”, and the difference between bases can be as large as a glass thickness. The tolerance should be cut from the amplitude–gap curve on a stated basis, and readings from feeler gauges or sensors converted back to the same basis; only then do supplier and customer figures agree.
Translated from the ENC7 Chinese technical library (article 0271). Read the Chinese original. Need a disc built to your drawing? Request a quote or see our custom encoder discs.
© Langfang Jingzheng Optoelectronic Technology Co., Ltd. All rights reserved. This article was created with AI assistance.