Glass & substrate science
Types of Fused Silica: Electric-Melt, Flame-Fused and Synthetic Quartz – Impurities and Hydroxyl
Fused silica is classed by melting route into electric-melt, flame-fused and synthetic types; hydroxyl runs from a few ppm to over a thousand ppm, and impurity and bubble grades differ. This article explains OH absorption strength at 2.73, 1.38 and 0.94 μm, calculates transmission differences among the types, and gives a way to choose by readout wavelength.
“Fused silica” is not one material. The same silica glass melted from natural crystal powder electrically, melted in an oxy-hydrogen flame, or vapour-synthesised from silicon tetrachloride can differ by orders of magnitude in impurities, bubbles and hydroxyl. Encoder LEDs mostly sit at 850–940 nm – does hydroxyl affect them? Is synthetic quartz worth the premium for that reason? The answer needs the hydroxyl absorption bands worked out.
Where the types come from
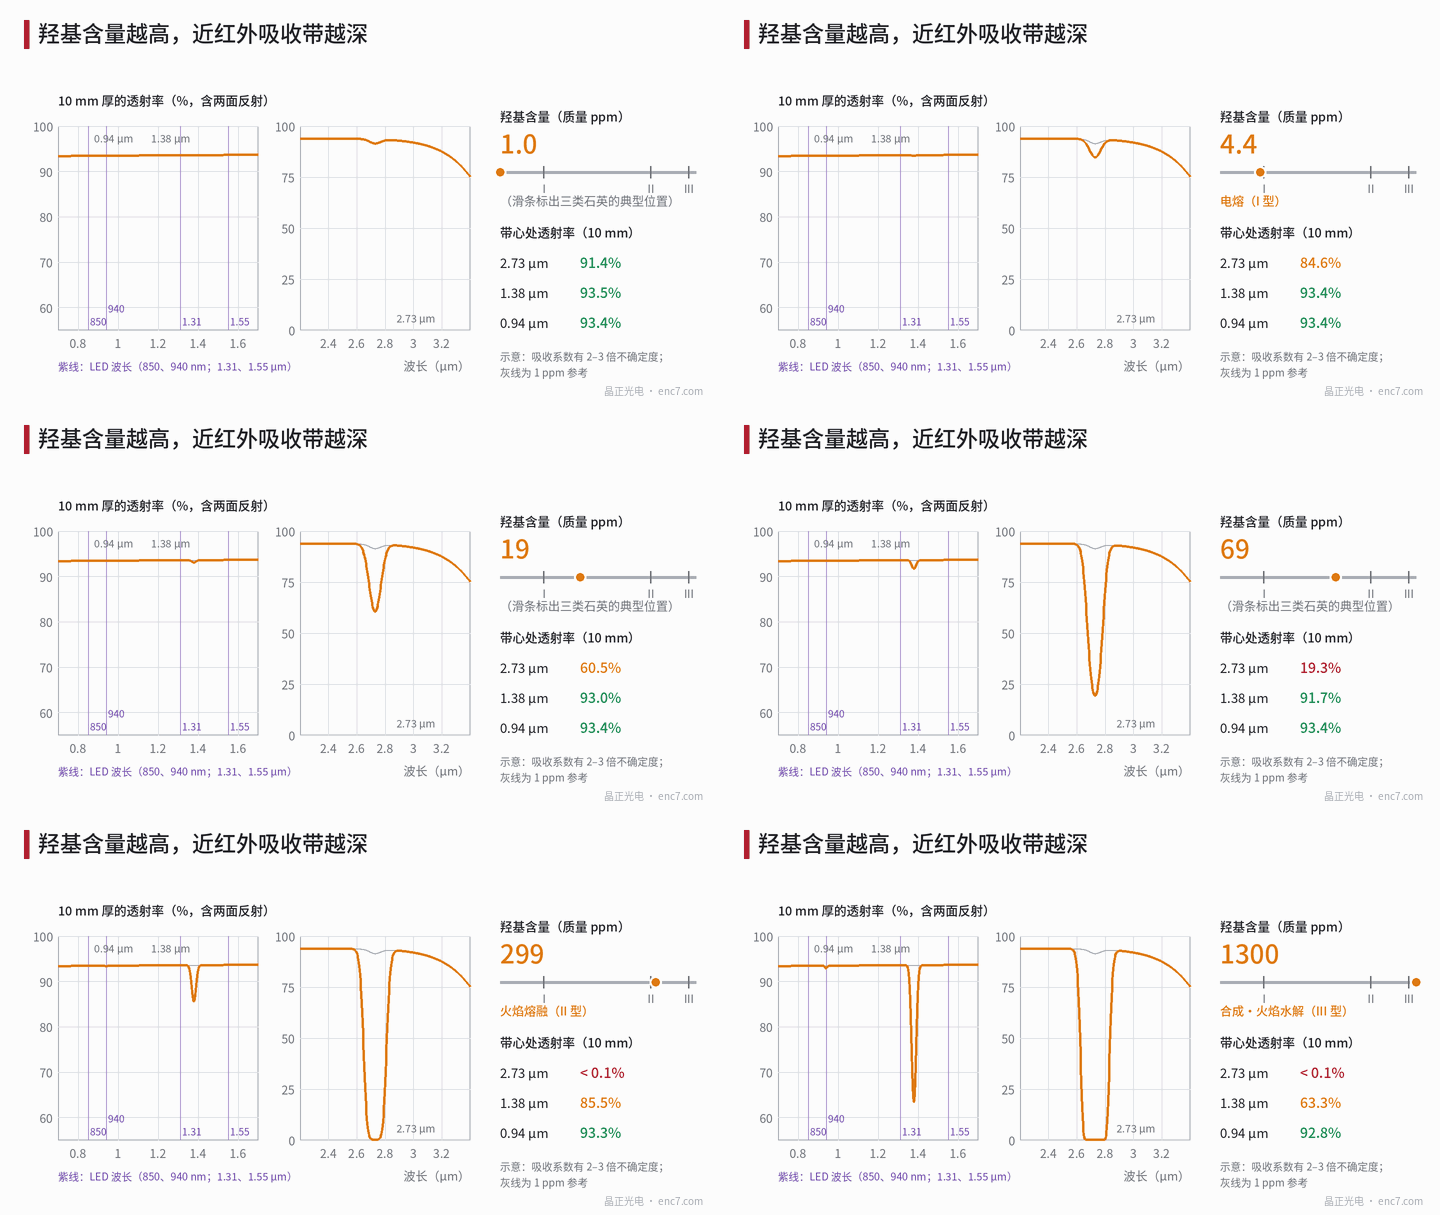
A common classification is Types I–IV; makers’ names are not uniform. Below they are split by melting route (Figure 2): electric-melt quartz uses natural crystal powder melted by electric heat – hydroxyl is very low, but metal impurities of the natural feedstock remain and bubbles and striae are usually more numerous; flame fusion also uses natural powder, melted in an oxy-hydrogen flame, with hydroxyl rising to hundreds of ppm; synthetic quartz is deposited by hydrolysis of silicon tetrachloride in an oxy-hydrogen flame – metal impurities below about 1 ppm, few bubbles and striae, but hydroxyl can reach over a thousand ppm; low-hydroxyl synthetic grades that switch to plasma or water-free flames combine high purity with low hydroxyl.
Hydroxyl absorption bands: position and strength
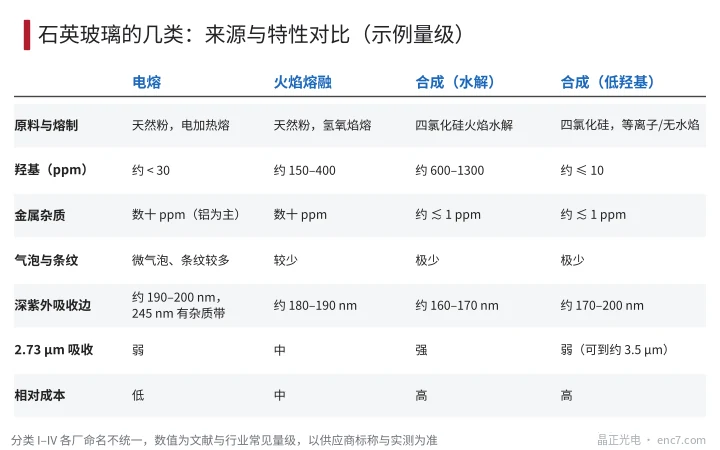
The Si–OH stretch has a fundamental absorption at 2.73 μm and first and second overtones near 1.38 μm and 0.94 μm; combination bands also sit at 2.21 μm and 1.24 μm. Absorption coefficient scales approximately linearly with hydroxyl content:
α(λ) = k(λ) · c_OH
where c_OH is the hydroxyl mass content (ppm) and k the absorption coefficient per unit content. Example values of k (cm⁻¹/ppm, natural logarithm): 2.73 μm 2.3×10⁻², 1.38 μm 3×10⁻⁴, 0.94 μm 5×10⁻⁶. The 2.73 μm value comes from the commonly used molar absorptivity of about 77.5 L/(mol·cm) and is also the basis of the hydroxyl assay: c_OH ≈ 100 × A / d, with A the common-log absorbance after baseline subtraction and d the thickness (cm). Coefficients at 1.38 and 0.94 μm differ among references by ppm basis (mass or molar) and carry a factor-of-2–3 uncertainty in the example; use them only for order of magnitude.
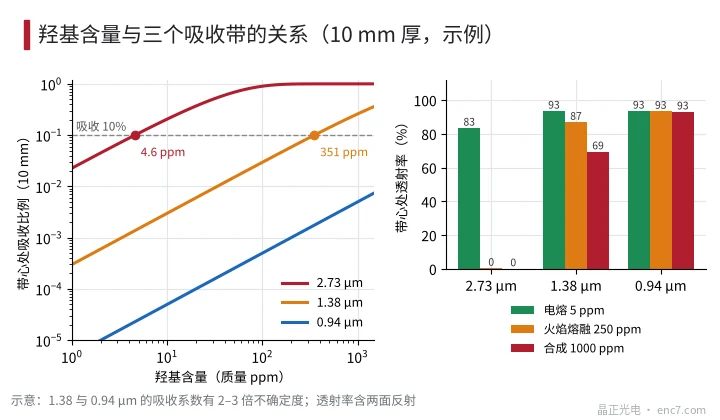
For 10 mm thickness including two-face reflection (refractive index about 1.45, Fresnel transmission about 93.4%), band-centre transmittance at three typical hydroxyl levels is:
| Type (hydroxyl) | 2.73 μm | 1.38 μm | 0.94 μm |
|---|---|---|---|
| Electric-melt (5 ppm) | 83% | 93% | 93% |
| Flame-fused (250 ppm) | 0.3% | 87% | 93% |
| Synthetic (1000 ppm) | < 0.1% | 69% | 93% |
Hydroxyl needed for 10% absorption (10 mm thick): about 4.6 ppm at 2.73 μm, about 350 ppm at 1.38 μm, about 2×10⁴ ppm at 0.94 μm – far above any practical quartz (Figure 3). So 850 nm and 940 nm LEDs are unaffected by hydroxyl; choice among types differs only in reflection loss. A few ppm already show at the 2.73 μm band; infrared work inside 3.5 μm needs low hydroxyl.
Ultraviolet, bubbles and other differences
Ultraviolet. Synthetic quartz can have a deep-UV absorption edge near 160–170 nm; natural-powder melts sit near 180–200 nm and often show an impurity band around 245 nm, with large batch scatter. Exposure and UV cure at 365 nm and 405 nm are fine for all types; for cleaning or exposure below 254 nm, synthetic quartz is favoured.
Bubbles and striae. Electric-melt quartz has more microbubbles; during chrome patterning they can cause pinholes and local scatter and affect line quality on encoder discs; synthetic quartz has the fewest bubbles and striae, better optical homogeneity, and a higher price.
High-temperature behaviour. Higher-hydroxyl types have slightly lower viscosity and somewhat poorer high-temperature stability – take maker data as authoritative; CTE of all these types is near about 0.5×10⁻⁶/K with no clear difference.
Choosing by wavelength
| Working condition | Preference |
|---|---|
| 850, 880, 940 nm LED; visible readout | Hydroxyl irrelevant; choose by bubbles, homogeneity and cost |
| 365, 405 nm exposure and UV cure | Any type |
| Cleaning and exposure below 254 nm | Synthetic quartz |
| 1.31–1.55 μm sources, longer path | Low hydroxyl; avoid the 1.38 μm band |
| 2–3.5 μm infrared | Low hydroxyl (IR grade) |
Engineering notes
- Ask the readout wavelength first: 850–940 nm LEDs are unaffected by hydroxyl – do not pay extra for hydroxyl alone.
- If the path has wavelengths near 1.38 μm or 2.73 μm, use a low-hydroxyl type and require the supplier to state hydroxyl content.
- Specify hydroxyl range, bubble grade and striae grade; those three decide performance more than the word “quartz”.
- For deep-UV cleaning or exposure choose synthetic and verify transmittance below 254 nm.
- For electric-melt quartz check bubbles and impurities and sample pinhole rate on blanks before chrome coating in volume.
- Assay hydroxyl by infrared spectroscopy: thickness 10 mm or more so low-hydroxyl samples are measurable.
Summary
Hydroxyl in fused silica runs from a few ppm to over a thousand ppm: a few ppm already show in the 2.73 μm fundamental, hundreds of ppm are needed at 1.38 μm, and 0.94 μm is essentially invisible. LED-readout encoder discs therefore need not choose synthetic quartz for hydroxyl; choose by bubbles, impurities and UV need. Infrared and deep-UV applications are where hydroxyl belongs in the purchase specification.
Translated from the ENC7 Chinese technical library (article 0570). Read the Chinese original. Need a disc built to your drawing? Request a quote or see our custom encoder discs.
© Langfang Jingzheng Optoelectronic Technology Co., Ltd. All rights reserved. This article was created with AI assistance.