Testing, reliability & quality
Weibull Statistics: Estimating Disc Failure Probability from Strength Tests

30 specimens average 114 MPa in strength—what is the failure probability of a disc at 30 MPa? This article derives the Weibull distribution from the weakest-link model, demonstrates probability-plot fitting, the confidence range of the shape parameter m, size-effect conversion and the calculation of allowable design stress with simulated data.
A bend-strength test of 30 glass specimens gives a mean of 114 MPa, a standard deviation of 17 MPa and a lowest piece of 80 MPa. A design stress of 30 MPa looks very safe. Extrapolating with a normal distribution, the failure probability at 30 MPa is about 4×10⁻⁷; with a Weibull distribution it is about 2.5×10⁻⁵—a factor of about 60. Which distribution brittle materials should use, and how reliable the extrapolation is, is what this article answers.
Weakest-link model and the Weibull distribution
The strength of glass is set by the most dangerous crack, just as a chain breaks at its weakest link. Divide the specimen into many small elements; as soon as one element fails the whole fails, so the survival probability of the whole equals the product of the survival probabilities of the elements. If the failure probability of an element grows with stress as a power law, the Weibull distribution follows:
F(σ) = 1 − exp[−(L/L0)·(σ/σ0)^m]
where F is the cumulative failure probability at stress σ, σ0 the characteristic strength (the stress at which 63.2% fail for reference size L0), m the shape parameter (Weibull modulus) and L the stressed size. For parts such as encoder discs that are dominated by edge defects, L is the length of edge under tension; for surface-defect dominance use area, for volume-defect dominance use volume.
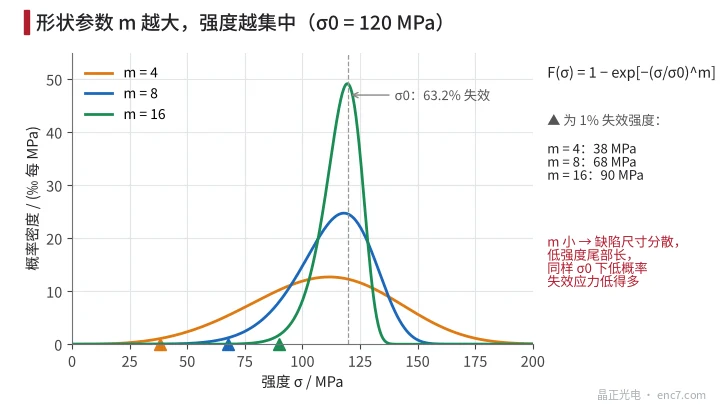
m reflects the scatter of defect size: the larger m, the tighter the strength (Figure 2). For the same σ0, m = 4, 8, 16 correspond to 1%-failure strengths of about 38, 68 and 90 MPa. Engineering glasses often have m from single digits to the teens, depending on process quality.
Obtaining m and σ0 from test data
Taking the double logarithm of F:
ln[−ln(1 − F)] = m·ln σ − m·ln σ0
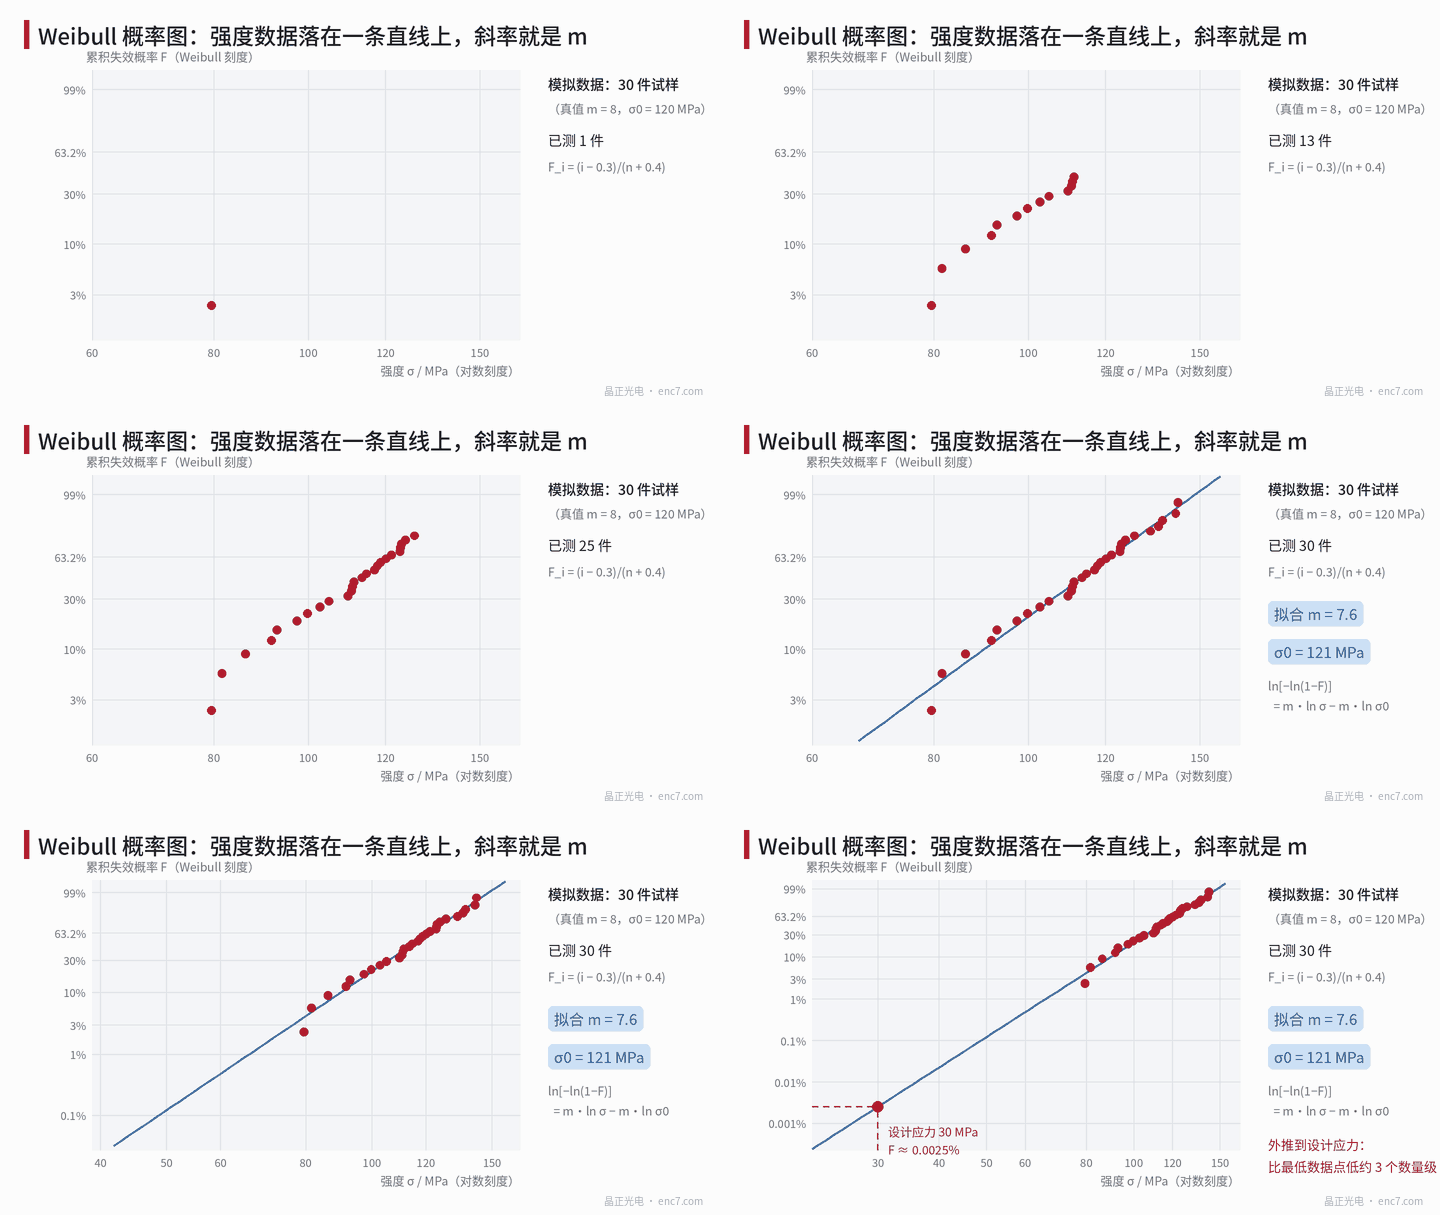
so on a probability plot with ln σ on the abscissa and ln[−ln(1−F)] on the ordinate, Weibull data form a straight line of slope m. The steps are:
- Rank the n strength values from smallest to largest; estimate the failure probability of the i-th by the median rank F_i = (i − 0.3)/(n + 0.4);
- Fit a straight line on the probability plot to obtain m and σ0;
- Maximum likelihood (MLE) can also be used; standards for ceramic strength data (e.g. ISO 20501) recommend MLE and give small-sample correction factors.
Example (simulated data, true m = 8, σ0 = 120 MPa, n = 30): regression gives m = 7.6, σ0 = 121 MPa; MLE gives m = 8.0, σ0 = 121 MPa.
Sample size governs how credible m is. From 5000 Monte Carlo runs: at n = 30, 90% of MLE m values fall in 6.6~10.6; at n = 10 the range widens to 5.9~14.6 and the mean is biased high by about 17%. σ0 is relatively stable.
Size effect: the specimen is not the part
The weakest-link model gives the size effect directly. At the same failure probability the strength ratio of two sizes is
σ_2 / σ_1 = (L_1 / L_2)^(1/m)
If the equivalent tensile-edge length of the part is 6 times that of the specimen (assumed), at m = 8 the part strength is only 6^(−1/8) ≈ 0.80 times the specimen; in the low-probability region the part’s failure probability is about 6 times that of the specimen.
When stress is non-uniform, replace L by the effective length L_eff = ∫(σ/σ_max)^m dL. The larger m, the more L_eff concentrates near the maximum stress. Three-point bend, four-point bend, ring-on-ring and other loadings have very different equivalent sizes and must be converted separately.
How to set the design stress
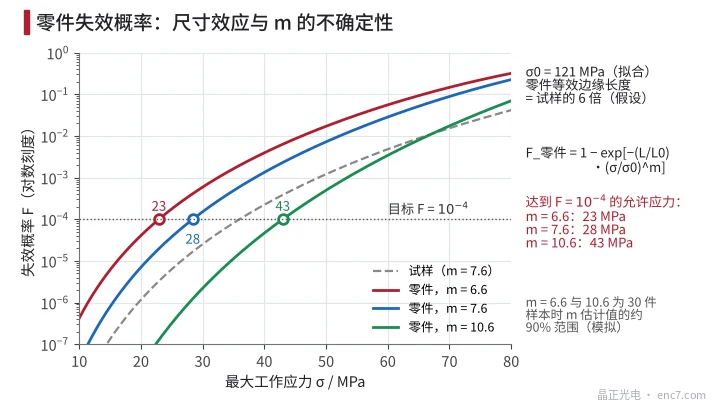
With a target failure probability of 10⁻⁴, a part equivalent edge length 6 times the specimen, and σ0 = 121 MPa, the allowable stress is
σ_allow = σ0·[−ln(1 − F) / 6]^(1/m)
With the fitted m = 7.6 it is about 28 MPa; with the lower end 6.6 of the 30-specimen range about 23 MPa; with the upper end 10.6 about 43 MPa (Figure 3). In the low-probability region, uncertainty in m matters far more than uncertainty in σ0; conservative design should use the lower confidence bound on m.
A further discount is needed for static fatigue: the test measures short-time strength; under long-term load cracks grow slowly and the allowable stress must be reduced further.
Engineering points
- Specimens must be made with the same cutting and edge-grinding process as the part, and the maximum stress must fall on the edge—otherwise a different defect population is being measured.
- Fractography on every piece to separate edge-initiated from surface-initiated failures; mixing the two bends the probability plot and they should be fitted separately.
- Sample size at least 30; 10 pieces only give the order of magnitude of m, and MLE results are biased high and need correction.
- When extrapolating to design stress use the lower confidence bound on m, and state the extrapolation span in the report: this example extrapolates about 3 orders of magnitude below the lowest data point.
- Compute the equivalent size of part and specimen carefully, especially when loadings differ; a size ratio of 6 already cuts strength by about 20% at m = 8.
- Where reliability requirements are high, a proof load above working stress on every piece can cull individuals with large defects—but assess damage caused by the loading itself.
Summary
Brittle-material strength is set by the weakest defect; the Weibull distribution describes its low-strength tail better than the normal. Obtain m and σ0 from a probability plot, then apply the size effect, and laboratory strength data convert into the failure probability of the part at design stress. The farther the extrapolation, the more critical the uncertainty in m; sample size and the lower confidence bound decide whether the conclusion is reliable.
Translated from the ENC7 Chinese technical library (article 0196). Read the Chinese original. Need a disc built to your drawing? Request a quote or see our custom encoder discs.
© Langfang Jingzheng Optoelectronic Technology Co., Ltd. All rights reserved. This article was created with AI assistance.